第二十四章 自定义指标
这是一组用来创建自定义指标的函数,这些函数不能用于编写EA交易程序 和 脚本。
| 函数 | 功能 |
|---|---|
| SetIndexBuffer | 将 指标缓冲区 和 一维双精度动态数组 绑定 |
| IndicatorSetDouble | 设置指标属性的 双精度型 值 |
| IndicatorSetInteger | 设置指标属性的 整型 值 |
| IndicatorSetString | 设置指标属性的 字符串 值 |
| PlotIndexSetDouble | 设置指标绘画线型属性的 双精度型 值 |
| PlotIndexSetInteger | 设置 指标绘画线型属性的 整型 值 |
| PlotIndexSetString | 设置指标绘画线型属性的 字符串 值 |
| PlotIndexGetInteger | 获取 指标绘画线型属性的 整型 值 |
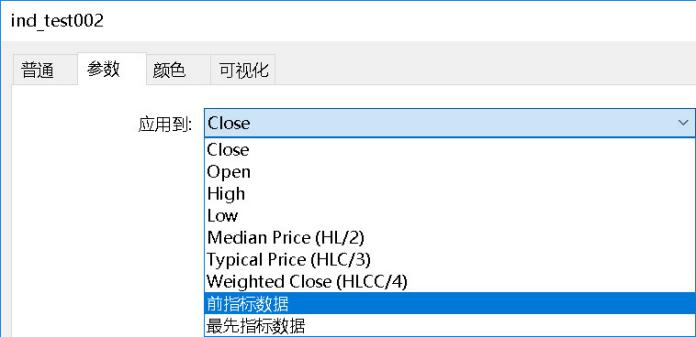
指标属性可以使用 编译器指令 或使用函数来设置。为了更好地理解这一点,建议您学习指标样式示例。
自定义指标中所有必要的运算都在预定义的OnCalculate()函数中,如果您使用短格式调用OnCalculate()函数,(OnCalculate有2个版本,此处指第1个版本)如
int OnCalculate (
const int rates_total,
const int prev_calculated,
const int begin,
const double& price[]
)
2
3
4
5
6
那么 rates_total 参数包括price[]数组中的全部元素的数量,以输入参数传递到计算指标值中。
参数 prev_calculated 是上次调用OnCalculate() 的计算结果,它允许组织用于计算指标值的节约算法。例如,如果当前值是rates_total = 1000, 而前值是prev_calculated = 999, 那么可能仅对每个指标缓冲区的一个值进行计算就足够了。
如果关于报价信息的输入数组price[]的大小信息不可用,那么将导致必须计算每个指标缓冲区的1000个值。在第一次调用OnCalculate()函数时,prev_calculated = 0。如果price []数组以某种方式改变,那么在这种情况下,prev_calculated也等于0。
begin参数表示价格数组原始值的数量,不包括计算数据。例如,如果Accelerator Oscillator 值(开头37个值没有计算)以输入参量使用,那么begin = 37。例如,列举一个简单指标:
begin参数显示价格数组初始值的数量,其中不包含用于计算的数据。 例如,如果指标Accelerator Oscillator 的值(前37个值未计算)用作输入参数,则begin = 37。示例,让我们考虑一个简单的指标:
#property indicator_chart_window
#property indicator_buffers 1
#property indicator_plots   1
//---- 绘图标签1
#property indicator_label1  "Label1"
#property indicator_type1   DRAW_LINE
#property indicator_color1  clrRed
#property indicator_style1  STYLE_SOLID
#property indicator_width1  1
//--- 指标缓冲区
double         Label1Buffer[];
//+------------------------------------------------------------------+
//| 自定义指标初始化函数                                                |
//+------------------------------------------------------------------+
void OnInit()
  {
//--- 指标缓冲区绘图
   SetIndexBuffer(0,Label1Buffer,INDICATOR_DATA);
//---
  }
//+------------------------------------------------------------------+
//| 自定义指标重复函数                                                  |
//+------------------------------------------------------------------+
int OnCalculate(const int rates_total,
                const int prev_calculated,
                const int begin,
                const double &price[])

  {
//---
   Print("begin = ",begin,"  prev_calculated = ",prev_calculated,"  rates_total = ",rates_total);
//--- 为下一次调用返回prev_calculated值
   return(rates_total);
  }
2
3
4
5
6
7
8
9
10
11
12
13
14
15
16
17
18
19
20
21
22
23
24
25
26
27
28
29
30
31
32
33
34
将其从“导航”窗口拖到 加速器振荡器(AC)指标的窗口中,并指出将根据前一个指标的值进行计算:(仅适用于 MT5 客户端 —— 智能交易*姚 提示)
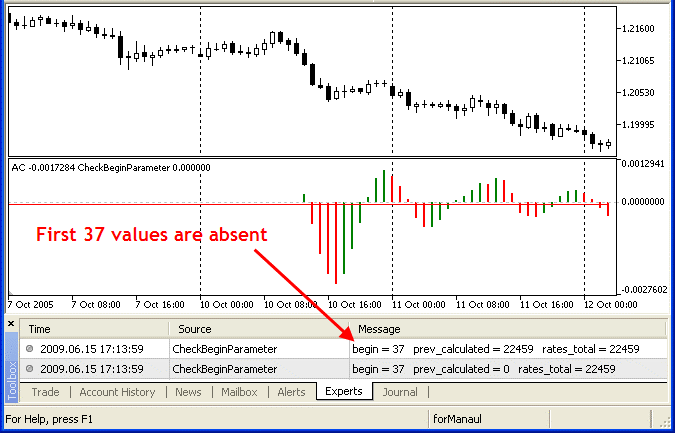
begin参数的值将精确地等于初始的K线柱的数量,此例中的 加速器振荡器(AC)指标 的值不是严格根据begin的值进行计算。如果我们查看自定义指标Accelerator.mq5的源代码,我们将在OnInit()函数中看到如下几行:
//--- 设置指标开始画线的第一个K线柱
   PlotIndexSetInteger(0,PLOT_DRAW_BEGIN,37);
2
使用函数PlotIndexSetInteger(0,PLOT_DRAW_BEGIN,empty_first_values),我们可以设置自定义指标中第一个指标数组中的不需要计算的零值的数量,我们不需要接受计算(empty_first_values)。 因此,我们有以下机制:
- 设置一个指标的初始值的数量,不应该用于另一个自定义指标的计算;
- 调用另一个自定义指标时,获取有关要忽略的第一个值的数量的信息,而不必考虑其计算逻辑。
# 24.1 指标的 绘制类型 示例
MetaTrader 5客户端包括38个技术指标,可以在MQL5程序中调用相对应的函数。但是,MQL5语言的主要优势在于能够创建自定义指标,然后可以在EA交易程序中使用这些指标,或者将其用于技术分析的价格图表。
指标的整个设定可以源自于几种基本的 绘制类型,即画线的样式。绘制画线表示一种显示数据的方式,可以用于指标计算,存储和提供数据。共有七种这样的基本 绘制类型:
- 直线
- 线段(直线的一节)
- 柱状图
- 箭头(符号)
- 填充区(填充的通道)
- 美式棒线图
- 日式蜡烛图
每个绘制画线都需要 一至五 个双精度类型的数组,指标值可以保存在其中。为方便起见,这些数组与指标缓冲区绑定关联。一个自定义指标的缓冲区数量必须使用编译程序指令提前声明,例如:
#property indicator_buffers 3 // 缓冲区数量
#property indicator_plots   2 // 绘制数量
2
指标缓冲区的数量通常大于或等于指标绘制画线的数量。
由于每种基本绘制类型都可以具有颜色变化或构造细节,因此MQL5中绘制类型的实际数量为18:
| 绘制类型 | 描述 | 价格缓冲区 | 颜色缓冲区 |
|---|---|---|---|
| DRAW_NONE | 不显示在图表中,但在数据窗口可以看到相应缓冲区的值 | 1 | - |
| DRAW_LINE | 根据相应的缓冲区中的值绘画直线(缓冲区不适合空值,因此直线是连续的) | 1 | - |
| DRAW_SECTION | 根据相应的缓冲区中的值绘画线段(通常有很多空值,线段是一节一节。) | 1 | - |
| DRAW_HISTOGRAM | 从 零 到 相应的缓冲区的值,绘制一个柱状线(可能有很多空值) | 1 | - |
| DRAW_HISTOGRAM2 | 绘制基于两个指标缓冲区之间的柱状线(可能有空值) | 2 | - |
| DRAW_ARROW | 绘制一个箭头符号(可能有空值) | 1 | - |
| DRAW_ZIGZAG | 类似于绘制线段(DRAW_SECTION)样式,但与其不同,可以在一根K线柱上绘制垂直线段 | 2 | - |
| DRAW_FILLING | 在两条线之间填充颜色。相应缓冲区的2个值显示在数据窗口 | 2 | - |
| DRAW_BARS | 绘制美式棒线。相应缓冲区的4个值显示在数据窗口 | 4 | - |
| DRAW_CANDLES | 绘制日式蜡烛线。相应缓冲区的4个值显示在数据窗口 | 4 | - |
| DRAW_COLOR_LINE | 您可以在不同K线柱上替换颜色或随时改变线的颜色 | 1 | 1 |
| DRAW_COLOR_SECTION | 类似 DRAW_SECTION 样式,但每段线段的颜色可以单独设置;颜色也可以动态设置 | 1 | 1 |
| DRAW_COLOR_HISTOGRAM | 类似 DRAW_HISTOGRAM 样式,但每一根柱状线都可能有不同的颜色,您可以设置动态颜色 | 1 | 1 |
| DRAW_COLOR_HISTOGRAM2 | 类似 DRAW_HISTOGRAM2 样式,但每一根柱状线都可能有不同的颜色,您可以设置动态颜色 | 2 | 1 |
| DRAW_COLOR_ARROW | 类似 DRAW_ARROW 样式,但每个符号都可能有它的颜色。颜色可以动态改变 | 1 | 1 |
| DRAW_COLOR_ZIGZAG | DRAW_ZIGZAG 样式具有线段单独颜色和动态颜色改变的选项 | 2 | 1 |
| DRAW_COLOR_BARS | DRAW_BARS 样式具有美式棒线单独颜色和动态颜色改变的选项 | 4 | 1 |
| DRAW_COLOR_CANDLES | DRAW_CANDLES 样式具有日式蜡烛图单独颜色和动态颜色改变的选项 | 4 | 1 |
指标缓冲区 和 数组 之间的不同
在每个自定义指标中,在全局范围上,您都应该声明一个或多个双精度类型的数组,然后必须使用SetIndexBuffer()函数将其绑定到指标缓冲区。若指标要绘制画线,只可使用指标缓冲区中的值,其它任何数组都不能用于此目的。另外,缓冲区的值会显示在数据窗口。
指标缓冲区应该是动态的,不需要指定大小 —— 用作指标缓冲区的数组的大小由客户终端执行子系统自动设置。
数组绑定指标缓冲区以后,索引的方向像普通数组一样默认设置,但是您可以使用ArraySetAsSeries()函数更改访问数组元素的方式。默认情况下,指标缓冲区用于存储绘制画线的数据(INDICATOR_DATA)。
如果指标值的计算需要保持中间计算并存储每根K线柱的额外值,然后这个数组可以被声明为绑定期间的计算缓冲区(INDICATOR_CALCULATIONS)。对于中间值,您也可以使用常规数组,但是在这种情况下,程序员必须管理数组大小。
一些绘制类型允许为每根K线柱设置颜色。若要存储颜色信息,需要使用颜色缓冲区(INDICATOR_COLOR_INDEX)。颜色值的类型是 整数型(color) ,但是所有 指标缓冲区 都必须是 双精度类型。颜色的值和辅助 (INDICATOR_CALCULATIONS) 缓冲区的值不能通过使用CopyBuffer()来获得。
指标缓冲区的数量必须使用预编译程序指令#property indicator_buffers number_of_buffers来指定:
#property indicator_buffers 3 // 指标有3个缓冲区
2
一个指标允许的最大缓冲区数量是512。
指标缓冲区 和 绘制画线的关联绑定
每个绘制画线都是基于一个或多个指标缓冲区。所以,若要显示简单的蜡烛图,则需要四个值 - 开盘价,最高价,最低价和收盘价。相应地,若要以蜡烛图的形式显示一个指标,必须为它们声明4个指标缓冲区和4个双精度类型的数组。例如:
//--- 指标有4个指标缓冲区
#property indicator_buffers 4
//--- 指标有一个 绘制类型
#property indicator_plots   1
//--- 绘制类型1将显示为蜡烛图
#property indicator_type1   DRAW_CANDLES
//--- 蜡烛图的颜色为clrDodgerBlue
#property indicator_color1  clrDodgerBlue
//--- 指标缓冲区的4个数组
double OBuffer[];
double HBuffer[];
double LBuffer[];
double CBuffer[];
2
3
4
5
6
7
8
9
10
11
12
13
绘制类型根据编号自动使用指标缓冲区。绘制编号从1开始,缓冲区数从0开始。如果第一个绘制类型需要4个指标缓冲区,那么开始的4个指标缓冲区将被用于1号绘制类型。这四个缓冲区应该使用SetIndexBuffer() 函数,以正确的索引编号绑定连接到相应的数组。
//--- 绑定数组和指标缓冲区
   SetIndexBuffer(0,OBuffer,INDICATOR_DATA);  // 第一个指标缓冲区 对应 索引编号0
   SetIndexBuffer(1,HBuffer,INDICATOR_DATA);  // 第二个指标缓冲区 对应 索引编号1
   SetIndexBuffer(2,LBuffer,INDICATOR_DATA);  // 第三个指标缓冲区 对应 索引编号2
   SetIndexBuffer(3,CBuffer,INDICATOR_DATA);  // 第四个指标缓冲区 对应 索引编号3
2
3
4
5
绘制蜡烛图,指标将只使用前面这四个缓冲区,因为“蜡烛图”的绘制类型的索引编号是在第一个数字下用预编译指令声明的。
现在我们来更改示例,并添加一条简单的绘制线 —— DRAW_LINE。现在假设这条线的编号为1,蜡烛图的编号为2。缓冲区的数量和绘制类型的数量都会增加。
//--- 指标有5个指标缓冲区
#property indicator_buffers 5
//--- 指标有2个 绘制类型
#property indicator_plots   2
//--- 绘制类型 1 是 直线
#property indicator_type1   DRAW_LINE
//--- 直线的颜色是 clrDodgerRed
#property indicator_color1  clrDodgerRed
//--- 绘制类型 2 是日式蜡烛图
#property indicator_type2   DRAW_CANDLES
//--- 蜡烛图的颜色是clrDodgerBlue
#property indicator_color2  clrDodgerBlue
//--- 指标缓冲区的5个数组
double LineBuffer[];
double OBuffer[];
double HBuffer[];
double LBuffer[];
double CBuffer[];
2
3
4
5
6
7
8
9
10
11
12
13
14
15
16
17
18
绘制类型的顺序也已经改变,现在 直线 是第一位,紧跟着是日式蜡烛图。因此,缓冲区的顺序也相应的发生了改变 —— 首先我们声明的是索引为0的 直线型的缓冲区,然后是四个用于绘制蜡烛图的缓冲区。
SetIndexBuffer(0,LineBuffer,INDICATOR_DATA);  // 第一个缓冲区对应0号绘制类型的索引,即画直线
//--- 绑定数组 和 蜡烛图指标缓冲区
   SetIndexBuffer(1,OBuffer,INDICATOR_DATA);  // 第二个缓冲区对应1号绘制类型的索引
   SetIndexBuffer(2,HBuffer,INDICATOR_DATA);  // 第三个缓冲区对应2号绘制类型的索引
   SetIndexBuffer(3,LBuffer,INDICATOR_DATA);  // 第四个缓冲区对应3号绘制类型的索引
   SetIndexBuffer(4,CBuffer,INDICATOR_DATA);  // 第五个缓冲区对应4号绘制类型的索引 二-五用于画蜡烛图
2
3
4
5
6
缓冲区 和 绘图类型 的数量仅可以通过使用预编译程序指令(#property)来设置,不可以使用函数动态改变这些属性。
颜色版本样式
正如表格中所见,基本绘制样式 被分成两组。第一组包括名字中无COLOR的样式,我们调用这些基本样式: • DRAW_LINE • DRAW_SECTION • DRAW_HISTOGRAM • DRAW_HISTOGRAM2 • DRAW_ARROW • DRAW_ZIGZAG • DRAW_FILLING • DRAW_BARS • DRAW_CANDLES
在第二组,样式名称包括 COLOR,我们称它们颜色版本: • DRAW_COLOR_LINE • DRAW_COLOR_SECTION • DRAW_COLOR_HISTOGRAM • DRAW_COLOR_HISTOGRAM2 • DRAW_COLOR_ARROW • DRAW_COLOR_ZIGZAG • DRAW_COLOR_BARS • DRAW_COLOR_CANDLES
所有颜色版本的样式不同于基本版,因为他们允许为绘制画图的每个部分指定颜色。绘制样式的最小部分是K线柱,所以我们可以说颜色版本允许在每个K线柱上设置颜色。
除了 DRAW_NONE 和 DRAW_FILLING样式,它们没有颜色版本。
若要在每个K线柱上设置绘制颜色,存储颜色索引的额外缓冲区已被添加到颜色版本中。这些索引在特定数组中指出颜色数量,包括预定颜色组。颜色数组大小是64。这意味着每个绘制样式的颜色版本都允许用64种不同的颜色来表现。
在指定颜色数组中,颜色的设置和数量可以通过预编译程序指令#property indicator_color来设置,在这里您可以通过逗号分隔指定所有必需的颜色。例如,指标中的这种输入:
//--- 定义8种颜色用于蜡烛图的显示颜色(它们存储在指定数组中)
#property indicator_color1  clrRed,clrBlue,clrGreen,clrYellow,clrMagenta,clrCyan,clrLime,clrOrange
2
上例中的预编译指令表示,对于绘制类型1,设置了8种颜色,这些颜色将放置在一个特殊的数组中。然后在程序中,我们不需要指定绘制类型的颜色,而只需指定它的索引编号即可。 如果我们要为K线设置红色,应该在指标的颜色缓冲区中设置数组中的颜色索引值。红色在预编译指令中是第一个,它对应的索引号是0。
  //--- 设置蜡烛图颜色clrRed
  col_buffer[buffer_index]=0;
2
这组颜色不是一劳永逸的,它可以使用PlotIndexSetInteger()动态改变。例:
//--- 为每个 绘制类型 设置颜色,像属性PLOT_LINE_COLOR
      PlotIndexSetInteger(0,                    //  绘制类型样式的索引编号
                          PLOT_LINE_COLOR,      //  属性标识符
                          plot_color_ind,       //  颜色标引,在这里我们编写颜色
                          color_array[i]);      //  新颜色
2
3
4
5
指标 和 绘制类型的属性
对于指标中的绘制类型,属性可以借助预编译程序指令和使用相应的函数进行设置。在指标属性 和 函数之间的绑定连接文章中阅读关于它的更多信息。使用指定函数动态改变指标属性允许创建更灵活的自定义指标。
图表上指标绘制的起点
在许多情况下,根据算法的条件,不可能在当前K线柱立即应用计算指标值,因为在历史记录中必须提供之前K线柱的最小数量。例如,许多平滑类型(如,平均线,加权等)意味着在之前的N根K线柱上使用价格数组,并且在这些值的基础上,计算当前K线柱的指标值。
在这种情况下,既无法为开始的N号K线柱计算指标值,也不能将这些值显示在图表上,而只是用于辅助计算进一步的值。为避免在历史记录的开始的N根K线柱上绘制指标,请在PLOT_DRAW_BEGIN属性中设置相应的N值:
//--- 绑定数组和蜡烛图的指标缓冲区
PlotIndexSetInteger(number_of_plot,PLOT_DRAW_BEGIN,N);
2
在这里: • number_of_plot —— 从0到indicator_plots - 1的值 (从0开始的绘制类型的编号数)。 • N —— 历史记录中开始K线柱的数量,在这里指标不显示在图表上。
# 24.1.1 DRAW_NONE
DRAW_NONE样式是专为需要计算缓冲区值 并且 只需要将其显示在数据窗口的情况下使用而设计的,但图表上的并不需要绘制画线。若要建立精度(即小数点后显示几位),请在OnInit()函数使用IndicatorSetInteger(INDICATOR_DIGITS,num_chars)表达式:
int OnInit()
  {
//--- 指标缓冲区映射
   SetIndexBuffer(0,InvisibleBuffer,INDICATOR_DATA);
//--- 设置显示在数据窗口的精度,即小数点后显示几位
   IndicatorSetInteger(INDICATOR_DIGITS,0);
//---
   return(INIT_SUCCEEDED);
  }
2
3
4
5
6
7
8
9
DRAW_NONE绘制样式所需的缓冲区的数量是1。
一个示例指标,在数据窗口显示鼠标当前悬停的K线柱对应的索引编号。该编号对应于时间序列,这意味着当前未完成的K线柱的索引编号为 零,并且最早的K线柱的索引编号最大。
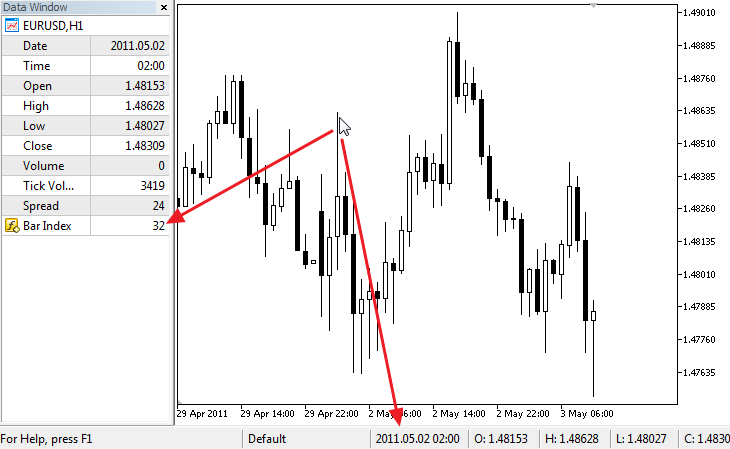
请注意,在示例的源码中,尽管事实上,设置了 绘制类型1的颜色为红色,但该指标不会在图表上绘制任何内容(因为 绘制样式 为 DRAW_NONE)。
//+------------------------------------------------------------------+
//|                                                    DRAW_NONE.mq5 |
//|                        Copyright 2011, MetaQuotes Software Corp. |
//|                                             https://www.mql5.com |
//+------------------------------------------------------------------+
#property copyright "Copyright 2011, MetaQuotes Software Corp."
#property link      "https://www.mql5.com"
#property version   "1.00"
#property indicator_chart_window
#property indicator_buffers 1
#property indicator_plots   1
//--- 绘制类型不可见
#property indicator_label1  "Bar Index"
#property indicator_type1   DRAW_NONE
#property indicator_style1  STYLE_SOLID
#property indicator_color1  clrRed
#property indicator_width1  1
//--- 指标缓冲区
double         InvisibleBuffer[];
//+------------------------------------------------------------------+
//| 自定义指标初始化函数                                                |
//+------------------------------------------------------------------+
int OnInit()
  {
//--- 绑定数组和指标缓冲区
   SetIndexBuffer(0,InvisibleBuffer,INDICATOR_DATA);
//--- 设置展示在数据窗口的精确值
   IndicatorSetInteger(INDICATOR_DIGITS,0);
//---
   return(INIT_SUCCEEDED);
  }
//+------------------------------------------------------------------+
//| 自定义指标迭代函数                                                 |
//+------------------------------------------------------------------+
int OnCalculate(const int rates_total,
                const int prev_calculated,
                const datetime &time[],
                const double &open[],
                const double &high[],
                const double &low[],
                const double &close[],
                const long &tick_volume[],
                const long &volume[],
                const int &spread[])
  {
   static datetime lastbar=0;
//--- 如果这是指标的第一次计算
   if(prev_calculated==0)
     {
      //--- 第一次重新编号柱形
      CalcValues(rates_total,close);
      //--- 在lastbar记下当前柱的开盘时间
      lastbar=(datetime)SeriesInfoInteger(_Symbol,_Period,SERIES_LASTBAR_DATE);
     }
   else
     {
      //--- 如果新柱出现,其开盘时间不同于lastbar
      if(lastbar!=SeriesInfoInteger(_Symbol,_Period,SERIES_LASTBAR_DATE))
        {
         //--- 再次重新编号柱形
         CalcValues(rates_total,close);
         //--- 在lastbar更新当前柱的开盘时间
         lastbar=(datetime)SeriesInfoInteger(_Symbol,_Period,SERIES_LASTBAR_DATE);
        }
     }
//--- 返回prev_calculated值以便下次调用
   return(rates_total);
  }
//+------------------------------------------------------------------+
//| 编制类似时间帧的柱形编号                                            |
//+------------------------------------------------------------------+
void CalcValues(int total,double const  &array[])
  {
//--- 设置时间帧的指标缓冲区标引
   ArraySetAsSeries(InvisibleBuffer,true);
//--- 用其编号填写每个柱形
   for(int i=0;i<total;i++) InvisibleBuffer[i]=i;
  }
2
3
4
5
6
7
8
9
10
11
12
13
14
15
16
17
18
19
20
21
22
23
24
25
26
27
28
29
30
31
32
33
34
35
36
37
38
39
40
41
42
43
44
45
46
47
48
49
50
51
52
53
54
55
56
57
58
59
60
61
62
63
64
65
66
67
68
69
70
71
72
73
74
75
76
77
78
# 24.1.2 DRAW_LINE
DRAW_LINE样式 根据 指标缓冲区的值 和 指定的颜色 画一条线。线的宽度,样式和颜色可以使用预编译器指令进行设置,并使用PlotIndexSetInteger()函数进行动态设置。绘图属性的动态变化允许“激活”指标,以便它们的外观根据当前情况而改变。
DRAW_LINE样式 所需的缓冲区数量是1个。
使用K线柱收盘价绘制线型的指标的示例。线型颜色,宽度和线型每N=5 个跳价都会随机变化一次。

请注意,在示例的源码中,最初DRAW_LINE的属性是使用预编译程序指令#property设置的,然后在OnCalculate()函数中对另三种属性(颜色,线型和宽度)随机设置。N参数设置为指标的外部参数,即表示可以手动配置(在指标属性窗口-->参数 标签中)。
//+------------------------------------------------------------------+
//|                                                    DRAW_LINE.mq5 |
//|                        Copyright 2011, MetaQuotes Software Corp. |
//|                                             https://www.mql5.com |
//+------------------------------------------------------------------+
#property copyright "Copyright 2011, MetaQuotes Software Corp."
#property link      "https://www.mql5.com"
#property version   "1.00"

#property description "An indicator to demonstrate DRAW_LINE"
#property description "It draws a line of a specified color at Close prices"
#property description "Color, width and style of lines is changed randomly"
#property description "after every N ticks"

#property indicator_chart_window
#property indicator_buffers 1
#property indicator_plots   1
//--- 线型属性使用预编译程序指令设置
#property indicator_label1  "Line"      // 数据窗口的标图名称
#property indicator_type1   DRAW_LINE   // 绘制类型是线型
#property indicator_color1  clrRed      // 线型颜色
#property indicator_style1  STYLE_SOLID // 线型样式
#property indicator_width1  1           // 线型宽度
//--- 输入参数
input int      N=5;         // 改变的订单号数量
//--- 绘制类型的指标缓冲区
double         LineBuffer[];
//--- 存储颜色的数组
color colors[]={clrRed,clrBlue,clrGreen};
//--- 存储线型样式的数组
ENUM_LINE_STYLE styles[]={STYLE_SOLID,STYLE_DASH,STYLE_DOT,STYLE_DASHDOT,STYLE_DASHDOTDOT};
//+------------------------------------------------------------------+
//| 自定义指标初始化函数                                                |
//+------------------------------------------------------------------+
int OnInit()
  {
//--- 绑定数组和指标缓冲区
   SetIndexBuffer(0,LineBuffer,INDICATOR_DATA);
//--- 初始化随机数字生成器
   MathSrand(GetTickCount());
//---
   return(INIT_SUCCEEDED);
  }
//+------------------------------------------------------------------+
//| 自定义指标迭代函数                                                  |
//+------------------------------------------------------------------+
int OnCalculate(const int rates_total,
                const int prev_calculated,
                const datetime &time[],
                const double &open[],
                const double &high[],
                const double &low[],
                const double &close[],
                const long &tick_volume[],
                const long &volume[],
                const int &spread[])
  {
   static int ticks=0;
//--- 计算订单号改变样式,颜色和线型宽度
   ticks++;
//--- 如果订单号的临界值被积累
   if(ticks>=N)
     {
      //--- 改变线型属性
      ChangeLineAppearance();
      //--- 重置0计数器
      ticks=0;
     }

//--- 计算指标值的模块
   for(int i=0;i<rates_total;i++)
     {
      LineBuffer[i]=close[i];
     }

//--- 返回prev_calculated值以便下次调用函数
   return(rates_total);
  }
//+------------------------------------------------------------------+
//| 改变指标中绘制的线型外观                                            |
//+------------------------------------------------------------------+
void ChangeLineAppearance()
  {
//--- 形成线型属性信息的字符串
   string comm="";
//--- 改变线型颜色的模块
//--- 获得随机数
   int number=MathRand();
//--- 除数等于colors[]数组的大小
   int size=ArraySize(colors);
//--- 获得选择新颜色作为整数除法余数的标引
   int color_index=number%size;
//--- 设置颜色为PLOT_LINE_COLOR属性
   PlotIndexSetInteger(0,PLOT_LINE_COLOR,colors[color_index]);
//--- 写下线型颜色
   comm=comm+(string)colors[color_index];

//--- 改变线型宽度的模块
   number=MathRand();
//--- 获得整数除法余数的宽度
   int width=number%5; // 宽度设置从 0 到 4
//--- 设置颜色为 PLOT_LINE_WIDTH 属性
   PlotIndexSetInteger(0,PLOT_LINE_WIDTH,width);
//--- 写下线型宽度
   comm=comm+", Width="+IntegerToString(width);

//--- 改变线型样式的模块
   number=MathRand();
//--- 除数等于样式数组的大小
   size=ArraySize(styles);
//--- 获得选择新样式作为整数除法余数的索引编号
   int style_index=number%size;
//--- 设置颜色为 PLOT_LINE_COLOR 属性
   PlotIndexSetInteger(0,PLOT_LINE_STYLE,styles[style_index]);
//--- 写下线型样式
   comm=EnumToString(styles[style_index])+", "+comm;
//--- 使用注释在图表上显示信息
   Comment(comm);
  }
2
3
4
5
6
7
8
9
10
11
12
13
14
15
16
17
18
19
20
21
22
23
24
25
26
27
28
29
30
31
32
33
34
35
36
37
38
39
40
41
42
43
44
45
46
47
48
49
50
51
52
53
54
55
56
57
58
59
60
61
62
63
64
65
66
67
68
69
70
71
72
73
74
75
76
77
78
79
80
81
82
83
84
85
86
87
88
89
90
91
92
93
94
95
96
97
98
99
100
101
102
103
104
105
106
107
108
109
110
111
112
113
114
115
116
117
118
119
# 24.1.3 DRAW_SECTION
DRAW_SECTION样式 根据指标缓冲区的值和指定的颜色绘制一条线段。线段的宽度,样式和颜色设置类似DRAW_LINE,可以使用预编译器指令进行设置,并使用PlotIndexSetInteger()函数进行动态设置。绘图属性的动态变化允许“激活”指标,以便它们的外观根据当前情况而改变。
从一个非空值到指标缓冲区的另一个非空值绘制节段,空值将被忽略。若要指定哪个值应被视为“空”,请在PLOT_EMPTY_VALUE属性设定该值:例如,如果指标应该被绘制为非零值的系列节段,然后您需要设置零值为空值:
画出线段是从指标缓冲区一个非空值开始画线,直到另一个非空值,指标缓冲区中的空值被忽略(即不画线段)。如果想要指定哪些值应该被视为“空”值,请在PLOT_EMPTY_VALUE属性中设置此值:例如,如果想要指标为非零值绘制一系列的线段,则需要将 零 值设置为 “空”值:
//---  0 (空)值将不参与绘制
   PlotIndexSetDouble(index_of_plot_DRAW_SECTION,PLOT_EMPTY_VALUE,0);
2
始终需要明确填写指标缓冲区的值,在缓冲区中设置一个“空”值用于不绘制画线的元素。
DRAW_SECTION样式所需的缓冲区的数量是 1个。
绘制最高价和最低价之间节段的指标示例。所有 节段的颜色,宽度和线型每N个订单号都会随机变化一次。
以下是一个指标示例,在 高价格 和 低价格 之间绘制线段。所有部分的颜色,宽度和线型每N个跳价会随机更改一次。

请注意,在示例的源码中,最初DRAW_SECTION的 属性 是使用预编译程序指令#property设置的,然后在OnCalculate()函数中对另三种属性(颜色,线型和宽度)随机设置。N参数设置为指标的外部参数,即表示可以手动配置(在指标属性窗口-->参数 标签中)。
//+------------------------------------------------------------------+
//|                                                 DRAW_SECTION.mq5 |
//|                        Copyright 2011, MetaQuotes Software Corp. |
//|                                             https://www.mql5.com |
//+------------------------------------------------------------------+
#property copyright "Copyright 2011, MetaQuotes Software Corp."
#property link      "https://www.mql5.com"
#property version   "1.00"

#property description "An indicator to demonstrate DRAW_SECTION"
#property description "Draws straight sections every bars bars"
#property description "The color, width and style of sections are changed randomly"
#property description "after every N ticks"

#property indicator_chart_window
#property indicator_buffers 1
#property indicator_plots   1
//--- 标图节段
#property indicator_label1  "Section"
#property indicator_type1   DRAW_SECTION
#property indicator_color1  clrRed
#property indicator_style1  STYLE_SOLID
#property indicator_width1  1
//--- 输入参数
input int      bars=5;           // 柱形节段长度
input int      N=5;              // 改变节段样式的订单号数量
//--- 标图的指标缓冲区
double         SectionBuffer[];
//--- 计算阶段终点的辅助变量
int            divider;
//--- 存储颜色的数组
color colors[]={clrRed,clrBlue,clrGreen};
//--- 存储线型样式的数组
ENUM_LINE_STYLE styles[]={STYLE_SOLID,STYLE_DASH,STYLE_DOT,STYLE_DASHDOT,STYLE_DASHDOTDOT};
//+------------------------------------------------------------------+
//| 自定义指标初始化函数                                                |
//+------------------------------------------------------------------+
int OnInit()
  {
//--- 绑定数组和指标缓冲区
   SetIndexBuffer(0,SectionBuffer,INDICATOR_DATA);
//--- 0 (空) 值将不参与绘制
   PlotIndexSetDouble(0,PLOT_EMPTY_VALUE,0);
//--- 检查指标参数
   if(bars<=0)
     {
      PrintFormat("Invalid value of parameter bar=%d",bars);
      return(INIT_PARAMETERS_INCORRECT);
     }
   else divider=2*bars;
//---+
   return(INIT_SUCCEEDED);
  }
//+------------------------------------------------------------------+
//| 自定义指标迭代函数                                                 |
//+------------------------------------------------------------------+
int OnCalculate(const int rates_total,
                const int prev_calculated,
                const datetime &time[],
                const double &open[],
                const double &high[],
                const double &low[],
                const double &close[],
                const long &tick_volume[],
                const long &volume[],
                const int &spread[])
  {
   static int ticks=0;
//--- 计算订单号改变样式,颜色和线型宽度
   ticks++;
//--- 如果订单号的临界值被积累
   if(ticks>=N)
     {
      //--- 改变线型属性
      ChangeLineAppearance();
      //--- 重置0计数器
      ticks=0;
     }

//--- 指标值计算开始的柱数
   int start=0;
//--- 如果之前计算了指标,那么在前一柱开始设置
   if(prev_calculated>0) start=prev_calculated-1;
//--- 这是指标值的全部计算
   for(int i=start;i<rates_total;i++)
     {
      //--- 获得柱数除以2*bars的余数
      int rest=i%divider;
      //--- 如果柱数可被2*bars除尽
      if(rest==0)
        {
         //--- 在该柱最高价设置节段终点
         SectionBuffer[i]=high[i];
        }
      //---如果除法的余数等于柱数,
      else
        {
         //--- 在该柱最高价设置节段终点
         if(rest==bars) SectionBuffer[i]=low[i];
         //--- 如果什么也没发生,忽略柱形 - 设置0
         else SectionBuffer[i]=0;
        }
     }
//--- 返回prev_calculated值以便下次调用函数
   return(rates_total);
  }
//+------------------------------------------------------------------+
//| 改变指标的节段外观                                                 |
//+------------------------------------------------------------------+
void ChangeLineAppearance()
  {
//--- 形成线型属性信息的字符串
   string comm="";
//--- 改变线型颜色的模块
   int number=MathRand(); // 获得随机数
//--- 除数等于colors[]数组的大小
   int size=ArraySize(colors);
//--- 获得选择新颜色作为整数除法余数的标引
   int color_index=number%size;
//--- 设置颜色为PLOT_LINE_COLOR属性
   PlotIndexSetInteger(0,PLOT_LINE_COLOR,colors[color_index]);
//--- 写下线型颜色
   comm=comm+"\r\n"+(string)colors[color_index];

//--- 改变线型宽度的模块
   number=MathRand();
//--- 获得整数除法余数的宽度
   int width=number%5;   // 宽度设置从 0 到 4
//--- 设置宽度
   PlotIndexSetInteger(0,PLOT_LINE_WIDTH,width);
//--- 写下线型宽度
   comm=comm+"\r\nWidth="+IntegerToString(width);

//--- 改变线型样式的模块
   number=MathRand();
//--- 除数等于样式数组的大小
   size=ArraySize(styles);
//--- 获得选择新样式作为整数除法余数的标引
   int style_index=number%size;
//--- 设置线型样式
   PlotIndexSetInteger(0,PLOT_LINE_STYLE,styles[style_index]);
//--- 写下线型样式
   comm="\r\n"+EnumToString(styles[style_index])+""+comm;
//--- 使用注释在图表上显示信息
   Comment(comm);
  }
2
3
4
5
6
7
8
9
10
11
12
13
14
15
16
17
18
19
20
21
22
23
24
25
26
27
28
29
30
31
32
33
34
35
36
37
38
39
40
41
42
43
44
45
46
47
48
49
50
51
52
53
54
55
56
57
58
59
60
61
62
63
64
65
66
67
68
69
70
71
72
73
74
75
76
77
78
79
80
81
82
83
84
85
86
87
88
89
90
91
92
93
94
95
96
97
98
99
100
101
102
103
104
105
106
107
108
109
110
111
112
113
114
115
116
117
118
119
120
121
122
123
124
125
126
127
128
129
130
131
132
133
134
135
136
137
138
139
140
141
142
143
144
145
146
# 24.1.4 DRAW_HISTOGRAM
DRAW_HISTOGRAM样式 根据 从0到指定值 和 指定颜色 绘制一个柱状线。指定值从指标缓冲区获得。柱状线的宽度,样式和颜色设置类似DRAW_LINE,可以使用预编译器指令进行设置,并使用PlotIndexSetInteger()函数进行动态设置。绘图属性的动态变化允许“激活”指标,以便柱状线的外观根据当前情况而改变。
因为每个柱状线都是从 0 开始画线,因此DRAW_HISTOGRAM应该更好地在 单独的图表窗口 中使用。大多数情况下,这种 绘制样式 用于创建 振荡器类型 的指标,例如Bears Power或OsMA。对于不可显示的空值,应指定 零 值。
DRAW_HISTOGRAM样式 所需的缓冲区的数量是 1个。
基于MathSin() 函数绘制指定颜色的正弦曲线的指标示例。所有柱状线的颜色,宽度和线型每N个跳价都会随机变化一次。柱状线的参数指定为正弦曲线周期,指定柱形数量之后,正弦曲线将重复这个循环。

请注意,在示例的源码中,最初DRAW_HISTOGRAM的 属性 是使用预编译程序指令#property设置的,然后在OnCalculate()函数中对另三种属性(颜色,线型和宽度)随机设置。N参数设置为指标的外部参数,即表示手动配置成为可能(在指标属性窗口-->参数 标签中)。
//+------------------------------------------------------------------+
//|                                               DRAW_HISTOGRAM.mq5 |
//|                        Copyright 2011, MetaQuotes Software Corp. |
//|                                             https://www.mql5.com |
//+------------------------------------------------------------------+
#property copyright "Copyright 2011, MetaQuotes Software Corp."
#property link      "https://www.mql5.com"
#property version   "1.00"

#property description "An indicator to demonstrate DRAW_HISTOGRAM"
#property description "It draws a sinusoid as a histogram in a separate window"
#property description "The color and width of columns are changed randomly"
#property description "after every N ticks"
#property description "The bars parameter sets the number of bars in the cycle of the sinusoid"

#property indicator_separate_window
#property indicator_buffers 1
#property indicator_plots   1
//--- 标图直方图
#property indicator_label1  "Histogram"
#property indicator_type1   DRAW_HISTOGRAM
#property indicator_color1  clrBlue
#property indicator_style1  STYLE_SOLID
#property indicator_width1  1
//--- 输入参数
input int      bars=30;          // 柱形的正弦曲线周期
input int      N=5;              // 改变直方图的订单号数量
//--- 指标缓冲区
double         HistogramBuffer[];
//--- 获得2Pi角弧度的因素,当乘以柱的参数时
double    multiplier;
//--- 存储颜色的数组
color colors[]={clrRed,clrBlue,clrGreen};
//--- 存储线型样式的数组
ENUM_LINE_STYLE styles[]={STYLE_SOLID,STYLE_DASH,STYLE_DOT,STYLE_DASHDOT,STYLE_DASHDOTDOT};
//+------------------------------------------------------------------+
//| 自定义指标初始化函数                                                |
//+------------------------------------------------------------------+
int OnInit()
  {
//--- 指标缓冲区映射
   SetIndexBuffer(0,HistogramBuffer,INDICATOR_DATA);
//--- 计算乘数
   if(bars>1)multiplier=2.*M_PI/bars;
   else
     {
      PrintFormat("Set the value of bars=%d greater than 1",bars);
      //--- 提前终止指标
      return(INIT_PARAMETERS_INCORRECT);
     }
//---
   return(INIT_SUCCEEDED);
  }
//+------------------------------------------------------------------+
//| 自定义指标迭代函数                                                 |
//+------------------------------------------------------------------+
int OnCalculate(const int rates_total,
                const int prev_calculated,
                const datetime &time[],
                const double &open[],
                const double &high[],
                const double &low[],
                const double &close[],
                const long &tick_volume[],
                const long &volume[],
                const int &spread[])
  {
   static int ticks=0;
//--- 计算订单号改变样式,颜色和线型宽度
   ticks++;
//--- 如果订单号的临界值被积累
   if(ticks>=N)
     {
      //--- 改变线型属性
      ChangeLineAppearance();
      //--- 重置0计数器
      ticks=0;
     }

//--- 计算指标值
   int start=0;
//--- 如果之前OnCalculate开始期间已经计算
   if(prev_calculated>0) start=prev_calculated-1; // 设置倒数第二柱为计算起点
//--- 填写指标缓冲区的值
   for(int i=start;i<rates_total;i++)
     {
      HistogramBuffer[i]=sin(i*multiplier);
     }
//--- 返回prev_calculated值以便下次调用函数
   return(rates_total);
  }
//+------------------------------------------------------------------+
//| 改变指标的线型外观                                                 |
//+------------------------------------------------------------------+
void ChangeLineAppearance()
  {
//--- 形成线型属性信息的字符串
   string comm="";
//--- 改变线型颜色的模块
   int number=MathRand(); // 获得随机数
//--- 除数等于colors[]数组的大小
   int size=ArraySize(colors);
//--- 获得选择新颜色作为整数除法余数的标引
   int color_index=number%size;
//--- 设置颜色为PLOT_LINE_COLOR属性
   PlotIndexSetInteger(0,PLOT_LINE_COLOR,colors[color_index]);
//--- 写下线型颜色
   comm=comm+"\r\n"+(string)colors[color_index];

//--- 改变线型宽度的模块
   number=MathRand();
//--- 获得整数除法余数的宽度
   int width=number%5;   // 宽度设置从 0 到 4
//--- 设置宽度
   PlotIndexSetInteger(0,PLOT_LINE_WIDTH,width);
//--- 写下线型宽度
   comm=comm+"\r\nWidth="+IntegerToString(width);

//--- 改变线型样式的模块
   number=MathRand();
//--- 除数等于样式数组的大小
   size=ArraySize(styles);
//--- 获得选择新样式作为整数除法余数的标引
   int style_index=number%size;
//--- 设置线型样式
   PlotIndexSetInteger(0,PLOT_LINE_STYLE,styles[style_index]);
//--- 写下线型样式
   comm="\r\n"+EnumToString(styles[style_index])+""+comm;
//--- 使用注释在图表上显示信息
   Comment(comm);
  }
2
3
4
5
6
7
8
9
10
11
12
13
14
15
16
17
18
19
20
21
22
23
24
25
26
27
28
29
30
31
32
33
34
35
36
37
38
39
40
41
42
43
44
45
46
47
48
49
50
51
52
53
54
55
56
57
58
59
60
61
62
63
64
65
66
67
68
69
70
71
72
73
74
75
76
77
78
79
80
81
82
83
84
85
86
87
88
89
90
91
92
93
94
95
96
97
98
99
100
101
102
103
104
105
106
107
108
109
110
111
112
113
114
115
116
117
118
119
120
121
122
123
124
125
126
127
128
129
130
131
# 24.1.5 DRAW_HISTOGRAM2
DRAW_HISTOGRAM2 样式根据 两个指标缓冲区的值 和 指定颜色 绘制一个垂直的柱状图。柱状线的宽度,样式和颜色设置类似DRAW_LINE,可以使用预编译器指令进行设置,并使用PlotIndexSetInteger()函数进行动态设置。绘图属性的动态变化允许“激活”指标,以便柱状线的外观根据当前情况而改变。
DRAW_HISTOGRAM2样式可以在图表的单独子窗口和主窗口中使用。对于空值,不绘制任何内容,需要明确的设置指标缓冲区中的所有值。缓冲区未初始化为零值。
绘制类型DRAW_HISTOGRAM2所需的缓冲区的数量是2。
指标示例:在每根K线柱的 开盘价 和 收盘价 之间绘制指定颜色和宽度的垂直柱状图。所有柱状图的颜色,宽度和样式每N个跳价都会随机变化一次。指标启动期间,在OnInit() 函数,一周中的第X天的柱状图不会绘制 —— invisible_day —— 随机设置。为此,空值设置 PLOT_EMPTY_VALUE=0:
//--- 设置空值
   PlotIndexSetDouble(index_of_plot_DRAW_SECTION,PLOT_EMPTY_VALUE,0);
2

请注意,在示例的源码中,最初DRAW_HISTOGRAM2的 属性 是使用预编译程序指令#property设置的,然后在OnCalculate()函数中对另三种属性(颜色,线型和宽度)随机设置。N参数设置为指标的外部参数,即表示手动配置成为可能(在指标属性窗口-->参数 标签中)。
//+------------------------------------------------------------------+
//|                                              DRAW_HISTOGRAM2.mq5 |
//|                        Copyright 2011, MetaQuotes Software Corp. |
//|                                             https://www.mql5.com |
//+------------------------------------------------------------------+
#property copyright "Copyright 2011, MetaQuotes Software Corp."
#property link      "https://www.mql5.com"
#property version   "1.00"

#property description "An indicator to demonstrate DRAW_HISTOGRAM2"
#property description "It draws a segment between Open and Close on each bar"
#property description "The color, width and style are changed randomly"
#property description "after every N ticks"

#property indicator_chart_window
#property indicator_buffers 2
#property indicator_plots   1
//--- 标图Histogram_2
#property indicator_label1  "Histogram_2"
#property indicator_type1   DRAW_HISTOGRAM2
#property indicator_color1  clrRed
#property indicator_style1  STYLE_SOLID
#property indicator_width1  1
//--- 输入参数
input int      N=5;              // 改变直方图的订单号数量
//--- 指标缓冲区
double         Histogram_2Buffer1[];
double         Histogram_2Buffer2[];
//--- 没有标图指标的工作日
int invisible_day;
//--- 存储颜色的数组0到5的
color colors[]={clrRed,clrBlue,clrGreen};
//--- 存储线型样式的数组
ENUM_LINE_STYLE styles[]={STYLE_SOLID,STYLE_DASH,STYLE_DOT,STYLE_DASHDOT,STYLE_DASHDOTDOT};
//+------------------------------------------------------------------+
//| 自定义指标初始化函数                                                |
//+------------------------------------------------------------------+
int OnInit()
  {
//--- 指标缓冲区映射
   SetIndexBuffer(0,Histogram_2Buffer1,INDICATOR_DATA);
   SetIndexBuffer(1,Histogram_2Buffer2,INDICATOR_DATA);
//--- 设置空值
   PlotIndexSetDouble(0,PLOT_EMPTY_VALUE,0);
//--- 获得从0到5的随机数
   invisible_day=MathRand()%6;
//---
   return(INIT_SUCCEEDED);
  }
//+------------------------------------------------------------------+
//| 自定义指标迭代函数                                                  |
//+------------------------------------------------------------------+
int OnCalculate(const int rates_total,
                const int prev_calculated,
                const datetime &time[],
                const double &open[],
                const double &high[],
                const double &low[],
                const double &close[],
                const long &tick_volume[],
                const long &volume[],
                const int &spread[])
  {
   static int ticks=0;
//--- 计算订单号改变样式,颜色和线型宽度
   ticks++;
//--- 如果订单号的临界值被积累
   if(ticks>=N)
     {
      //--- 改变线型属性
      ChangeLineAppearance();
      //--- 重置0计数器
      ticks=0;
     }

//--- 计算指标值
   int start=0;
//--- 通过每柱的开盘价获得工作日
   MqlDateTime dt;
//---如果之前OnCalculate开始期间已经计算
   if(prev_calculated>0) start=prev_calculated-1; // 在倒数第二柱设置计算起点
//--- 填写指标缓冲区的值
   for(int i=start;i<rates_total;i++)
     {
      TimeToStruct(time[i],dt);
      if(dt.day_of_week==invisible_day)
        {
         Histogram_2Buffer1[i]=0;
         Histogram_2Buffer2[i]=0;
        }
      else
        {
         Histogram_2Buffer1[i]=open[i];
         Histogram_2Buffer2[i]=close[i];
        }
     }
//--- 返回prev_calculated值以便下次调用函数
   return(rates_total);
  }
//+------------------------------------------------------------------+
//| 改变指标的线型外观                                                 |
//+------------------------------------------------------------------+
void ChangeLineAppearance()
  {
//--- 形成线型属性信息的字符串
   string comm="";
//--- 线型颜色变化模块
   int number=MathRand(); // 获得随机数
//--- 除数等于colors[]数组的大小
   int size=ArraySize(colors);
//--- 获得选择新颜色作为整数除法余数的标引
   int color_index=number%size;
//--- 设置颜色为 PLOT_LINE_COLOR 属性
   PlotIndexSetInteger(0,PLOT_LINE_COLOR,colors[color_index]);
//--- 写下线型颜色
   comm=comm+"\r\n"+(string)colors[color_index];

//--- 改变线型宽度的模块
   number=MathRand();
//--- 获得整数除法余数的宽度
   int width=number%5;   // 宽度设置从 0 到 4
//--- 设置线型宽度
   PlotIndexSetInteger(0,PLOT_LINE_WIDTH,width);
//--- 写下线型宽度
   comm=comm+"\r\nWidth="+IntegerToString(width);

//--- 改变线型样式的模块
   number=MathRand();
//--- 除数等于样式数组的大小
   size=ArraySize(styles);
//--- 获得选择新样式作为整数除法余数的标引
   int style_index=number%size;
//--- 设置线型样式
   PlotIndexSetInteger(0,PLOT_LINE_STYLE,styles[style_index]);
//--- 写下线型样式
   comm="\r\n"+EnumToString(styles[style_index])+""+comm;
//--- 添加计算中省略的工作日的信息
   comm="\r\nNot plotted day - "+EnumToString((ENUM_DAY_OF_WEEK)invisible_day)+comm;
//--- 使用注释在图表上显示信息
   Comment(comm);
  }
2
3
4
5
6
7
8
9
10
11
12
13
14
15
16
17
18
19
20
21
22
23
24
25
26
27
28
29
30
31
32
33
34
35
36
37
38
39
40
41
42
43
44
45
46
47
48
49
50
51
52
53
54
55
56
57
58
59
60
61
62
63
64
65
66
67
68
69
70
71
72
73
74
75
76
77
78
79
80
81
82
83
84
85
86
87
88
89
90
91
92
93
94
95
96
97
98
99
100
101
102
103
104
105
106
107
108
109
110
111
112
113
114
115
116
117
118
119
120
121
122
123
124
125
126
127
128
129
130
131
132
133
134
135
136
137
138
139
140
141
# 24.1.6 DRAW_ARROW
DRAW_ARROW样式根据 指标缓冲区的值 和 指定颜色 绘制箭头( Wingdings的设置符号) 。符号的宽度,样式和颜色设置类似DRAW_LINE,可以使用预编译器指令进行设置,并使用PlotIndexSetInteger()函数进行动态设置。绘图属性的动态变化允许“激活”指标,以便柱状线的外观根据当前情况而改变。
符号代码使用PLOT_ARROW 属性进行设置。
//--- 定义PLOT_ARROW绘制的来自Wingdings字体的符号代码到
   PlotIndexSetInteger(0,PLOT_ARROW,code);
2
PLOT_ARROW的默认值 = 159(一个圆圈)。
每个箭头实际上都是有 高度 和 定位点(锚点) 的符号,可以覆盖图表上的一些重要信息(例如,K线柱的收盘价)。因此,我们还可以指定垂直方向上的偏移距离,以像素为单位,这并不依赖图表的比例。虽然指标的值将会保持不变,但画出来的箭头会按指定的像素数量向下移动一段距离:
//--- 设置箭头的像素垂直移动
   PlotIndexSetInteger(0,PLOT_ARROW_SHIFT,shift);
2
PLOT_ARROW_SHIFT的负值表示画箭头时向上偏移,正值表示画箭头时向下偏移。
DRAW_ARROW 样式可以用在 单独的图表子窗口 和 主窗口。由于不绘制空值并且也不会出现在"数据窗口",指标缓冲区的所有值都应该明确设定。缓冲区不用零值初始化。
//--- 设置空值
   PlotIndexSetDouble(index_of_plot_DRAW_ARROW,PLOT_EMPTY_VALUE,0);
2
DRAW_ARROW样式所需的缓冲区的数量是 1。
一个指标示例,该指标在K线柱上绘制一个箭头,条件是这个K线柱的 收盘价 高于前一根K线柱的 收盘价。每N个跳价之后随机更改所有箭头的颜色,宽度,偏移距离和符号代码。
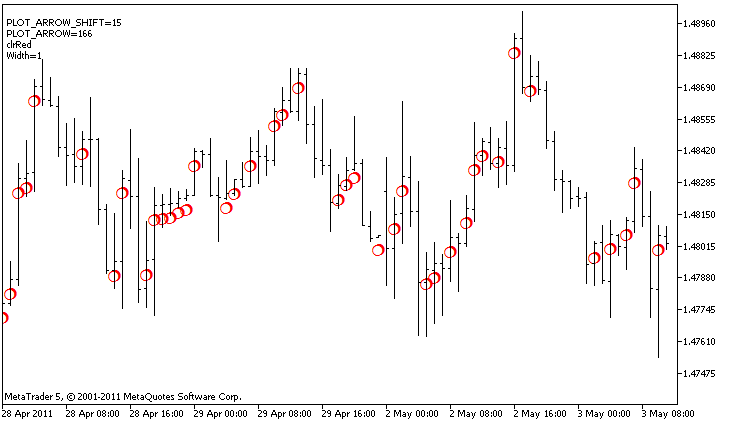
请注意,在示例的源码中,最初DRAW_ARROW的 属性 是使用预编译程序指令#property设置的,然后在OnCalculate()函数中对另三种属性(颜色,线型和宽度)随机设置。N参数设置为指标的外部参数,即表示手动配置成为可能(在指标属性窗口-->参数 标签中)。
//+------------------------------------------------------------------+
//|                                                   DRAW_ARROW.mq5 |
//|                        Copyright 2011, MetaQuotes Software Corp. |
//|                                             https://www.mql5.com |
//+------------------------------------------------------------------+
#property copyright "Copyright 2011, MetaQuotes Software Corp."
#property link      "https://www.mql5.com"
#property version   "1.00"

#property description "An indicator to demonstrate DRAW_ARROW"
#property description "Draws arrows set by Unicode characters, on a chart"
#property description "The color, size, shift and symbol code of the arrow are changed in a random way"
#property description "after every N ticks"
#property description "The code parameter sets the base value: code=159 (a circle)"

#property indicator_chart_window
#property indicator_buffers 1
#property indicator_plots   1
//--- 标图箭头
#property indicator_label1  "Arrows"
#property indicator_type1   DRAW_ARROW
#property indicator_color1  clrGreen
#property indicator_width1  1
//--- 输入参数
input int      N=5;         // 改变订单号数量
input ushort   code=159;    // 在DRAW_ARROW绘制的符号代码
//--- 标图的指标缓冲区
double         ArrowsBuffer[];
//--- 存储颜色的数组0到5的
color colors[]={clrRed,clrBlue,clrGreen};
//+------------------------------------------------------------------+
//| 自定义指标初始化函数                                                |
//+------------------------------------------------------------------+
int OnInit()
  {
//--- 指标缓冲区映射
   SetIndexBuffer(0,ArrowsBuffer,INDICATOR_DATA);
//--- 定义PLOT_ARROW绘制的符号代码
   PlotIndexSetInteger(0,PLOT_ARROW,code);
//--- 设置箭头的像素垂直移动
   PlotIndexSetInteger(0,PLOT_ARROW_SHIFT,5);
//--- 设置空值为 0
   PlotIndexSetDouble(0,PLOT_EMPTY_VALUE,0);
//---
   return(INIT_SUCCEEDED);
  }
//+------------------------------------------------------------------+
//| 自定义指标迭代函数                                                 |
//+------------------------------------------------------------------+
int OnCalculate(const int rates_total,
                const int prev_calculated,
                const datetime &time[],
                const double &open[],
                const double &high[],
                const double &low[],
                const double &close[],
                const long &tick_volume[],
                const long &volume[],
                const int &spread[])
  {
   static int ticks=0;
//--- 计算订单号改变颜色,大小,移动和箭头的代码
   ticks++;
//--- 如果订单号的临界值被积累
   if(ticks>=N)
     {
      //--- 改变线型属性
      ChangeLineAppearance();
      //--- 重置0计数器
      ticks=0;
     }

//--- 计算指标值的模块
   int start=1;
   if(prev_calculated>0) start=prev_calculated-1;
//--- 计算循环
   for(int i=1;i < rates_total;i++)
     {
      //--- 如果当前收盘价高于之前的价格,请绘制一个箭头
      if(close[i]>close[i-1])
         ArrowsBuffer[i]=close[i];
      //--- 否则指定零值
      else
         ArrowsBuffer[i]=0;
     }
//--- 返回 prev_calculated值以便下次调用函数
   return(rates_total);
  }
//+------------------------------------------------------------------+
//| 改变指标的交易品种外观                                              |
//+------------------------------------------------------------------+
void ChangeLineAppearance()
  {
//--- 形成指标属性信息的字符串
   string comm="";
//--- 改变箭头颜色的模块
   int number=MathRand(); // 获得随机数
//--- 除数等于colors[]数组的大小
   int size=ArraySize(colors);
//--- 获得选择新颜色作为整数除法余数的标引
   int color_index=number%size;
//--- 设置颜色为 PLOT_LINE_COLOR 属性
   PlotIndexSetInteger(0,PLOT_LINE_COLOR,colors[color_index]);
//--- 写下线型颜色
   comm=comm+"\r\n"+(string)colors[color_index];

//--- 改变大小箭头的模块
   number=MathRand();
//--- 获得整数除法余数的宽度
   int width=number%5;   // 大小设置从 0 到 4
//--- 设置颜色为PLOT_LINE_WIDTH属性
   PlotIndexSetInteger(0,PLOT_LINE_WIDTH,width);
//--- 写下箭头大小
   comm=comm+"\r\nWidth="+IntegerToString(width);

//--- 改变箭头代码 (PLOT_ARROW)的模块
   number=MathRand();
//--- 获得整数除法的余数来计算新的箭头代码(从0到19)
   int code_add=number%20;
//--- 设置新的符号代码作为ode+code_add的结果
   PlotIndexSetInteger(0,PLOT_ARROW,code+code_add);
//--- 写下符号代码 PLOT_ARROW
   comm="\r\n"+"PLOT_ARROW="+IntegerToString(code+code_add)+comm;

//--- 改变箭头的像素垂直移动的模块
   number=MathRand();
//--- 获得整数除法余数的移动
   int shift=20-number%41;
//--- 设置新移动从 -20 到 20
   PlotIndexSetInteger(0,PLOT_ARROW_SHIFT,shift);
//--- 写下PLOT_ARROW_SHIFT移动
   comm="\r\n"+"PLOT_ARROW_SHIFT="+IntegerToString(shift)+comm;

//--- 使用注释在图表上显示信息
   Comment(comm);
  }
2
3
4
5
6
7
8
9
10
11
12
13
14
15
16
17
18
19
20
21
22
23
24
25
26
27
28
29
30
31
32
33
34
35
36
37
38
39
40
41
42
43
44
45
46
47
48
49
50
51
52
53
54
55
56
57
58
59
60
61
62
63
64
65
66
67
68
69
70
71
72
73
74
75
76
77
78
79
80
81
82
83
84
85
86
87
88
89
90
91
92
93
94
95
96
97
98
99
100
101
102
103
104
105
106
107
108
109
110
111
112
113
114
115
116
117
118
119
120
121
122
123
124
125
126
127
128
129
130
131
132
133
134
135
136
# 24.1.7 DRAW_ZIGZAG
DRAW_ZIGZAG 样式根据 两个指标缓冲区的值 和 指定的颜色 绘制线段。此样式与DRAW_SECTION非常相似,但与后者不太相同(DRAW_SECTION的 指标缓冲区 是1个),DRAW_ZIGZAG允许在一根K线柱内绘制垂直线段,两个指标缓冲区的值均设置在一根K线柱上的话。线段从第一个缓冲区的值 绘制 到第二个指标缓冲区的值。缓冲区不会只包含空值,因为在这种情况下,不会画出线段。
线的宽度,样式和颜色设置类似DRAW_SECTION,可以使用预编译器指令进行设置,并使用PlotIndexSetInteger()函数进行动态设置。绘图属性的动态变化允许“激活”指标,以便柱状线的外观根据当前情况而改变。
从一个缓冲区的非空值到另一个指标缓冲区的非空值画出线段。若要指定哪个值应被视为“空”,请在 PLOT_EMPTY_VALUE 属性中设定该值:
//--- 0(空)值将不参与绘制
   PlotIndexSetDouble(index_of_plot_DRAW_ZIGZAG,PLOT_EMPTY_VALUE,0);
2
始终需要明确的填写指标缓冲区的值,在缓冲区中设置空值以跳过相对应的K线柱。
DRAW_ZIGZAG样式所需的缓冲区的数量是2个。
一个指标示例,基于 最高价 和 最低价 绘制线段。ZIGZAG 线段的颜色,宽度和线型每N 个跳价之后都会随机变化一次。

请注意,最初DRAW_ZIGZAG样式的 属性 是使用预编译程序指令#property设置的,然后在OnCalculate()函数中对另三种属性(颜色,线型和宽度)随机设置。N参数设置为指标的外部参数,即表示手动配置成为可能(在指标属性窗口-->参数 标签中)。
//+------------------------------------------------------------------+
//|                                                  DRAW_ZIGZAG.mq5 |
//|                        Copyright 2011, MetaQuotes Software Corp. |
//|                                             https://www.mql5.com |
//+------------------------------------------------------------------+
#property copyright "Copyright 2011, MetaQuotes Software Corp."
#property link      "https://www.mql5.com"
#property version   "1.00"

#property description "An indicator to demonstrate DRAW_ZIGZAG"
#property description "It draws a \"saw\" as straight segments, skipping the bars of one day"
#property description "The day to skip is selected randomly during indicator start"
#property description "The color, width and style of segments are changed randomly"
#property description " every N ticks"

#property indicator_separate_window
#property indicator_buffers 2
#property indicator_plots   1
//--- 标图ZigZag
#property indicator_label1  "ZigZag"
#property indicator_type1   DRAW_ZIGZAG
#property indicator_color1  clrBlue
#property indicator_style1  STYLE_SOLID
#property indicator_width1  1
//--- 输入参数
input int      N=5;              // 改变订单号数量
//--- 指标缓冲区
double         ZigZagBuffer1[];
double         ZigZagBuffer2[];
//--- 没有标图指标的工作日
int invisible_day;
//--- 存储颜色的数组0到5的
color colors[]={clrRed,clrBlue,clrGreen};
//--- 存储线型样式的数组
ENUM_LINE_STYLE styles[]={STYLE_SOLID,STYLE_DASH,STYLE_DOT,STYLE_DASHDOT,STYLE_DASHDOTDOT};
//+------------------------------------------------------------------+
//| 自定义指标初始化函数                                                |
//+------------------------------------------------------------------+
int OnInit()
  {
//--- 绑定数组和指标缓冲区
   SetIndexBuffer(0,ZigZagBuffer1,INDICATOR_DATA);
   SetIndexBuffer(1,ZigZagBuffer2,INDICATOR_DATA);
//--- 获得从0到6的随机值,在这一天不标图指标
   invisible_day=MathRand()%6;
//--- 0(空)值将不参与绘制
   PlotIndexSetDouble(0,PLOT_EMPTY_VALUE,0);
//--- 0(空)值将不参与绘制
   PlotIndexSetString(0,PLOT_LABEL,"ZigZag1;ZigZag2");
//---
   return(INIT_SUCCEEDED);
  }
//+------------------------------------------------------------------+
//| 自定义指标迭代函数                                                 |
//+------------------------------------------------------------------+
int OnCalculate(const int rates_total,
                const int prev_calculated,
                const datetime &time[],
                const double &open[],
                const double &high[],
                const double &low[],
                const double &close[],
                const long &tick_volume[],
                const long &volume[],
                const int &spread[])
  {
   static int ticks=0;
//--- 计算订单号改变样式,颜色和线型宽度
   ticks++;
//--- 如果足够数量的订单号被积累
   if(ticks>=N)
     {
      //--- 改变线型属性
      ChangeLineAppearance();
      //--- 重置0计数器
      ticks=0;
     }

//--- 获得每个柱形工作日所需的时间结构
   MqlDateTime dt;

//--- 计算的初始位置
   int start=0;
//--- 如果在前一个订单号计算指标,那么在倒数第二个开始计算
   if(prev_calculated!=0) start=prev_calculated-1;
//--- 计算循环
   for(int i=start;i<rates_total;i++)
     {
      //--- 在结构中写下柱形的开盘时间
      TimeToStruct(time[i],dt);
      //--- 如果该柱的工作日等于invisible_day
      if(dt.day_of_week==invisible_day)
        {
         //--- 写下该柱形的缓冲区空值
         ZigZagBuffer1[i]=0;
         ZigZagBuffer2[i]=0;
        }
      //--- 如果工作日没问题,填写缓冲区
      else
        {
         //--- 如果柱形数量
         if(i%2==0)
           {
            //---  在第一个缓冲区写下最高价,在第二个缓冲区写下最低价
            ZigZagBuffer1[i]=high[i];
            ZigZagBuffer2[i]=low[i];
           }
         //--- 柱形数量是奇数
         else
           {
            //--- 按相反顺序填写柱形
            ZigZagBuffer1[i]=low[i];
            ZigZagBuffer2[i]=high[i];
           }
        }
     }
//--- 返回 prev_calculated值以便下次调用函数
   return(rates_total);
  }
//+------------------------------------------------------------------+
//| 改变zigzag节段的外观                                               |
//+------------------------------------------------------------------+
void ChangeLineAppearance()
  {
//--- 形成ZigZag属性信息的字符串
   string comm="";
//--- 改变ZigZag颜色的模块
   int number=MathRand(); // 获得随机数
//--- 除数等于colors[]数组的大小
   int size=ArraySize(colors);
//--- 获得选择新颜色作为整数除法余数的标引
   int color_index=number%size;
//--- 设置颜色为 PLOT_LINE_COLOR 属性
   PlotIndexSetInteger(0,PLOT_LINE_COLOR,colors[color_index]);
//--- 写下线型颜色
   comm=comm+"\r\n"+(string)colors[color_index];

//--- 改变线型宽度的模块
   number=MathRand();
//--- 获得整数除法余数的宽度
   int width=number%5;   // 宽度设置从 0 到 4
//--- 设置颜色为PLOT_LINE_WIDTH属性
   PlotIndexSetInteger(0,PLOT_LINE_WIDTH,width);
//--- 写下线型宽度
   comm=comm+"\r\nWidth="+IntegerToString(width);

//--- 改变线型样式的模块
   number=MathRand();
//--- 除数等于样式数组的大小
   size=ArraySize(styles);
//--- 获得选择新样式作为整数除法余数的标引
   int style_index=number%size;
//--- 设置颜色为 PLOT_LINE_COLOR 属性
   PlotIndexSetInteger(0,PLOT_LINE_STYLE,styles[style_index]);
//--- 写下线型样式
   comm="\r\n"+EnumToString(styles[style_index])+""+comm;
//--- 添加计算中省略的工作日的信息
   comm="\r\nNot plotted day - "+EnumToString((ENUM_DAY_OF_WEEK)invisible_day)+comm;
//--- 使用注释在图表上显示信息
   Comment(comm);
  }
2
3
4
5
6
7
8
9
10
11
12
13
14
15
16
17
18
19
20
21
22
23
24
25
26
27
28
29
30
31
32
33
34
35
36
37
38
39
40
41
42
43
44
45
46
47
48
49
50
51
52
53
54
55
56
57
58
59
60
61
62
63
64
65
66
67
68
69
70
71
72
73
74
75
76
77
78
79
80
81
82
83
84
85
86
87
88
89
90
91
92
93
94
95
96
97
98
99
100
101
102
103
104
105
106
107
108
109
110
111
112
113
114
115
116
117
118
119
120
121
122
123
124
125
126
127
128
129
130
131
132
133
134
135
136
137
138
139
140
141
142
143
144
145
146
147
148
149
150
151
152
153
154
155
156
157
158
159
160
161
# 24.1.8 DRAW_FILLING
DRAW_FILLING 样式在两个指标缓冲区之间绘制填充颜色区域。实际上,该样式绘制两条线,并用指定的两种颜色中的一种填充两条线之间的空间。它用于创建绘制通道的指标。缓冲区不会只包含空值,因为在这种情况下,不会绘制任何颜色区域。
您可以设置两种填充颜色: • 第一个颜色用于 第一个缓冲区的值 大于 第二个指标缓冲区的值 的区域; • 第二个颜色用于 相反的情况。
填充颜色可以使用预编译器指令进行设置 或 使用PlotIndexSetInteger()函数进行动态设置。绘图属性的动态变化允许“激活”指标,以便于可以根据当前状况改变其外观。
该指标计算所有K线柱的指标,两个指标缓冲区的值既不等于0也不等于空值。若要指定应将哪个值视为“空”,请在PLOT_EMPTY_VALUE属性中设置此值:
#define INDICATOR_EMPTY_VALUE -1.0

//--- INDICATOR_EMPTY_VALUE (空值) 将不参与计算
   PlotIndexSetDouble (DRAW_FILLING_creation_index,PLOT_EMPTY_VALUE,INDICATOR_EMPTY_VALUE);
2
3
4
不参与指标计算的K线柱的绘制将取决于指标缓冲区的值: • 两个指标缓冲区的值都等于0的柱形,不参与绘制指标。这意味着零值的区域不填充。

• 指标缓冲区的值等于"空值"的K线柱,参与绘制指标。空值区域将被填充,以便连接有重要值的区域。

应该注意,如果"空值"等于零,不参与指标计算的K线柱也会被填充。
DRAW_FILLING样式所需的缓冲区的数量是 2。
指标示例:在独立(副图)窗口中以不同周期参数的两个均线之间绘制通道。在移动平均线视觉交叉的颜色变化显示了向上向下趋势的变化。每N 个跳价之后都会随机变化一次颜色。 N参数设置为指标的外部参数,即表示手动配置成为可能(在指标属性窗口-->参数 标签中)。

请注意,最初DRAW_FILLING样式的 属性 是使用预编译程序指令#property设置的,然后在OnCalculate()函数中对颜色随机设置。
//+------------------------------------------------------------------+
//|                                                 DRAW_FILLING.mq5 |
//|                        Copyright 2011, MetaQuotes Software Corp. |
//|                                             https://www.mql5.com |
//+------------------------------------------------------------------+
#property copyright "Copyright 2011, MetaQuotes Software Corp."
#property link      "https://www.mql5.com"
#property version   "1.00"

#property description "An indicator to demonstrate DRAW_FILLING"
#property description "It draws a channel between two MAs in a separate window"
#property description "The fill color is changed randomly"
#property description "after every N ticks"

#property indicator_separate_window
#property indicator_buffers 2
#property indicator_plots   1
//--- 标图交集
#property indicator_label1  "Intersection"
#property indicator_type1   DRAW_FILLING
#property indicator_color1  clrRed,clrBlue
#property indicator_width1  1
//--- 输入参数
input int      Fast=13;          // 快速MA的周期
input int      Slow=21;          // 慢速MA的周期
input int      shift=1;          // 向未来的MAs转移(正值)
input int      N=5;              // 改变订单号数量
//--- 指标缓冲区
double         IntersectionBuffer1[];
double         IntersectionBuffer2[];
int fast_handle;
int slow_handle;
//--- 存储颜色的数组0到5的
color colors[]={clrRed,clrBlue,clrGreen,clrAquamarine,clrBlanchedAlmond,clrBrown,clrCoral,clrDarkSlateGray};
//+------------------------------------------------------------------+
//| 自定义指标初始化函数                                                |
//+------------------------------------------------------------------+
int OnInit()
  {
//--- 指标缓冲区映射
   SetIndexBuffer(0,IntersectionBuffer1,INDICATOR_DATA);
   SetIndexBuffer(1,IntersectionBuffer2,INDICATOR_DATA);
//---
   PlotIndexSetInteger(0,PLOT_SHIFT,shift);
//---
   fast_handle=iMA(_Symbol,_Period,Fast,0,MODE_SMA,PRICE_CLOSE);
   slow_handle=iMA(_Symbol,_Period,Slow,0,MODE_SMA,PRICE_CLOSE);
//---
   return(INIT_SUCCEEDED);
  }
//+------------------------------------------------------------------+
//| 自定义指标迭代函数                                                  |
//+------------------------------------------------------------------+
int OnCalculate(const int rates_total,
                const int prev_calculated,
                const datetime &time[],
                const double &open[],
                const double &high[],
                const double &low[],
                const double &close[],
                const long &tick_volume[],
                const long &volume[],
                const int &spread[])
  {
   static int ticks=0;
//--- 计算订单号改变样式,颜色和线型宽度
   ticks++;
//--- 如果足够数量的订单号被积累
   if(ticks>=N)
     {
      //--- 改变线型属性
      ChangeLineAppearance();
      //--- 重置0计数器
      ticks=0;
     }

//--- 指标的第一次计算,或数据变化,需要一次完全重新计算
   if(prev_calculated==0)
     {
      //--- 复制所有指标值至相应的缓冲区
      int copied1=CopyBuffer(fast_handle,0,0,rates_total,IntersectionBuffer1);
      int copied2=CopyBuffer(slow_handle,0,0,rates_total,IntersectionBuffer2);
     }
   else // 仅填充那些更新的数据
     {
      //--- 获得OnCalculate()当前和之前启动之间的柱形不同
      int to_copy=rates_total-prev_calculated;
      //--- 如果没有不同,我们仍然会复制一个值 - 在零柱
      if(to_copy==0) to_copy=1;
      //--- 复制_copy 值到指标缓冲区的最末端
      int copied1=CopyBuffer(fast_handle,0,0,to_copy,IntersectionBuffer1);
      int copied2=CopyBuffer(slow_handle,0,0,to_copy,IntersectionBuffer2);
     }
//--- 返回 prev_calculated值以便下次调用函数
   return(rates_total);
  }
//+------------------------------------------------------------------+
//| 改变通道填充颜色                                                   |
//+------------------------------------------------------------------+
void ChangeLineAppearance()
  {
//--- 形成线型属性信息的字符串
   string comm="";
//--- 改变线型颜色的模块
   int number=MathRand(); // 获得随机数
//--- 除数等于colors[]数组的大小
   int size=ArraySize(colors);

//--- 获得选择新颜色作为整数除法余数的标引
   int color_index1=number%size;
//--- 设置第一个颜色为PLOT_LINE_COLOR 属性
   PlotIndexSetInteger(0,PLOT_LINE_COLOR,0,colors[color_index1]);
//--- 写下第一个颜色
   comm=comm+"\r\nColor1 "+(string)colors[color_index1];

//--- 获得选择新颜色作为整数除法余数的标引
   number=MathRand(); // 获得随机数
   int color_index2=number%size;
//--- 设置第二个颜色为PLOT_LINE_COLOR 属性
   PlotIndexSetInteger(0,PLOT_LINE_COLOR,1,colors[color_index2]);
//---写下第二个颜色
   comm=comm+"\r\nColor2 "+(string)colors[color_index2];
//--- 使用注释在图表上显示信息
   Comment(comm);
  }
2
3
4
5
6
7
8
9
10
11
12
13
14
15
16
17
18
19
20
21
22
23
24
25
26
27
28
29
30
31
32
33
34
35
36
37
38
39
40
41
42
43
44
45
46
47
48
49
50
51
52
53
54
55
56
57
58
59
60
61
62
63
64
65
66
67
68
69
70
71
72
73
74
75
76
77
78
79
80
81
82
83
84
85
86
87
88
89
90
91
92
93
94
95
96
97
98
99
100
101
102
103
104
105
106
107
108
109
110
111
112
113
114
115
116
117
118
119
120
121
122
123
124
125
# 24.1.9 DRAW_BARS
DRAW_BARS 样式根据四个指标缓冲区的值来绘制美式棒线图,包括开盘价,最高价,最低价和收盘价。它用于创建自定义指标的美式棒线图,可以应用在单独的图表(副图)子窗口中 或/和 其它 金融工具(交易品种) 的主图表上(即叠加K线图表)。
美式棒线图的颜色设置可以使用预编译器指令进行设置,并使用PlotIndexSetInteger()函数进行动态设置。绘图属性的动态变化允许“激活”指标,以便美式棒线图的外观根据当前情况而改变。
该指标仅绘制那些设置了所有四个指标缓冲区的非空值的K线柱(意即 开盘价,最高价,最低价和收盘价都要有确定的值)。要指定应将哪个值视为“空”,请在PLOT_EMPTY_VALUE属性中设置此值:
//--- 0(空)值将不参与绘制
   PlotIndexSetDouble(index_of_plot_DRAW_BARS,PLOT_EMPTY_VALUE,0);
2
始终需要明确的填写指标缓冲区的值,在缓冲区中设置空值以跳过相对应的K线柱。
DRAW_BARS样式所需的缓冲区的数量是4。该样式的所有缓冲区都应该按照给定的顺序一个接一个地进行:即开盘价,最高价,最低价和收盘价。缓冲区不会只包含空值,因为在这种情况下,不会绘制任何图形。
指标示例:在单独(副图)窗口中的为选定的金融工具(交易品种)绘制美式棒线图。美式棒线图的颜色每 N个跳价之后都会随机变化一次。N参数设置为指标的外部参数,即表示手动配置成为可能(在指标属性窗口-->参数 标签中)。

请注意,最初DRAW_BARS样式的 属性 是使用编译程序指令 #property设置的,然后在 OnCalculate() 函数中对颜色随机设置。
//+------------------------------------------------------------------+
//|                                                    DRAW_BARS.mq5 |
//|                        Copyright 2011, MetaQuotes Software Corp. |
//|                                             https://www.mql5.com |
//+------------------------------------------------------------------+
#property copyright "Copyright 2011, MetaQuotes Software Corp."
#property link      "https://www.mql5.com"
#property version   "1.00"

#property description "An indicator to demonstrate DRAW_BARS"
#property description "It draws bars of a selected symbol in a separate window"
#property description "The color and width of bars, as well as the symbol are changed randomly"
#property description "every N ticks"

#property indicator_separate_window
#property indicator_buffers 4
#property indicator_plots   1
//--- 标图柱形
#property indicator_label1  "Bars"
#property indicator_type1   DRAW_BARS
#property indicator_color1  clrGreen
#property indicator_style1  STYLE_SOLID
#property indicator_width1  1
//--- 输入参数
input int      N=5;              // 改变类型的订单号数量
input int      bars=500;         // 显示的柱形数量
input bool     messages=false;   // 在"EA交易"日志显示信息
//--- 指标缓冲区
double         BarsBuffer1[];
double         BarsBuffer2[];
double         BarsBuffer3[];
double         BarsBuffer4[];
//--- 交易品种名称
string symbol;
//--- 存储颜色的数组0到5的
color colors[]={clrRed,clrBlue,clrGreen,clrPurple,clrBrown,clrIndianRed};
//+------------------------------------------------------------------+
//| 自定义指标初始化函数                                                |
//+------------------------------------------------------------------+
int OnInit()
  {
//--- 如果柱形非常小 - 提前完成工作
   if(bars<50)
     {
      Comment("Please specify a larger number of bars! The operation of the indicator has been terminated");
      return(INIT_PARAMETERS_INCORRECT);
     }
//--- 指标缓冲区映射
   SetIndexBuffer(0,BarsBuffer1,INDICATOR_DATA);
   SetIndexBuffer(1,BarsBuffer2,INDICATOR_DATA);
   SetIndexBuffer(2,BarsBuffer3,INDICATOR_DATA);
   SetIndexBuffer(3,BarsBuffer4,INDICATOR_DATA);
//--- 绘制柱形的交易品种名称
   symbol=_Symbol;
//--- 设置交易品种的展示
   PlotIndexSetString(0,PLOT_LABEL,symbol+" Open;"+symbol+" High;"+symbol+" Low;"+symbol+" Close");
   IndicatorSetString(INDICATOR_SHORTNAME,"DRAW_BARS("+symbol+")");
//--- 空值
   PlotIndexSetDouble(0,PLOT_EMPTY_VALUE,0.0);
//---
   return(INIT_SUCCEEDED);
  }
//+------------------------------------------------------------------+
//| 自定义指标迭代函数                                                 |
//+------------------------------------------------------------------+
int OnCalculate(const int rates_total,
                const int prev_calculated,
                const datetime &time[],
                const double &open[],
                const double &high[],
                const double &low[],
                const double &close[],
                const long &tick_volume[],
                const long &volume[],
                const int &spread[])
  {
   static int ticks=0;
//--- 计算订单号改变样式,颜色和线型宽度
   ticks++;
//--- 如果足够数量的订单号被积累
   if(ticks>=N)
     {
      //--- 选择来自市场报价窗口的新交易品种
      symbol=GetRandomSymbolName();
      //--- 改变线型属性
      ChangeLineAppearance();

      int tries=0;
      //--- 试图5 次填充缓冲区的交易品种价格
      while(!CopyFromSymbolToBuffers(symbol,rates_total) && tries<5)
        {
         //--- CopyFromSymbolToBuffers() 函数调用的计数器
         tries++;
        }
      //--- 重置0计数器
      ticks=0;
     }
//--- 返回 prev_calculated值以便下次调用函数
   return(rates_total);
  }
//+------------------------------------------------------------------+
//| 填充指标缓冲区的价格                                                |
//+------------------------------------------------------------------+
bool CopyFromSymbolToBuffers(string name,int total)
  {
//--- 在rates[] 数组中,我们将复制开盘价,最高价,最低价和收盘价
   MqlRates rates[];
//--- 尝试计数器
   int attempts=0;
//--- 已复制多少
   int copied=0;
//--- 试图25次获得所需交易品种的时间帧
   while(attempts<25 && (copied=CopyRates(name,_Period,0,bars,rates))<0)
     {
      Sleep(100);
      attempts++;
      if(messages) PrintFormat("%s CopyRates(%s) attempts=%d",__FUNCTION__,name,attempts);
     }
//--- 如果复制足够数量的柱形失败
   if(copied!=bars)
     {
      //--- 形成信息字符串
      string comm=StringFormat("For the symbol %s, managed to receive only %d bars of %d requested ones",
                               name,
                               copied,
                               bars
                               );
      //--- 在主图表窗口的注释中显示信息
      Comment(comm);
      //--- 显示信息
      if(messages) Print(comm);
      return(false);
     }
   else
     {
      //--- 设置交易品种的展示
      PlotIndexSetString(0,PLOT_LABEL,name+" Open;"+name+" High;"+name+" Low;"+name+" Close");
      IndicatorSetString(INDICATOR_SHORTNAME,"DRAW_BARS("+name+")");
     }
//--- 初始化空值缓冲区
   ArrayInitialize(BarsBuffer1,0.0);
   ArrayInitialize(BarsBuffer2,0.0);
   ArrayInitialize(BarsBuffer3,0.0);
   ArrayInitialize(BarsBuffer4,0.0);
//--- 复制缓冲区的价格
   for(int i=0;i<copied;i++)
     {
      //--- 计算缓冲区相应的标引
      int buffer_index=total-copied+i;
      //--- 写下缓冲区的价格
      BarsBuffer1[buffer_index]=rates[i].open;
      BarsBuffer2[buffer_index]=rates[i].high;
      BarsBuffer3[buffer_index]=rates[i].low;
      BarsBuffer4[buffer_index]=rates[i].close;
     }
   return(true);
  }
//+------------------------------------------------------------------+
//| 随机返回来自市场报价的交易品种                                       |
//+------------------------------------------------------------------+
string GetRandomSymbolName()
  {
//--- 市场报价窗口中显示的交易品种数量
   int symbols=SymbolsTotal(true);
//--- 列表中的交易品种位置 - 从0到交易品种的随机号
   int number=MathRand()%symbols;
//--- 返回指定位置的交易品种名称
   return SymbolName(number,true);
  }
//+------------------------------------------------------------------+
//| 改变柱形的外观                                                     |
//+------------------------------------------------------------------+
void ChangeLineAppearance()
  {
//--- 形成柱形属性信息的字符串
   string comm="";
//---改变柱形颜色的模块
   int number=MathRand(); // 获得随机数
//--- 除数等于colors[]数组的大小
   int size=ArraySize(colors);
//--- 获得选择新颜色作为整数除法余数的标引
   int color_index=number%size;
//--- 设置颜色为 PLOT_LINE_COLOR 属性
   PlotIndexSetInteger(0,PLOT_LINE_COLOR,colors[color_index]);
//--- 写下线型颜色
   comm=comm+"\r\n"+(string)colors[color_index];

//--- 改变柱形宽度的模块
   number=MathRand();
//--- 获得整数除法余数的宽度
   int width=number%5;   // 宽度设置从 0 到 4
//--- 设置颜色为PLOT_LINE_WIDTH属性
   PlotIndexSetInteger(0,PLOT_LINE_WIDTH,width);
//--- 写下线型宽度
   comm=comm+"\r\nWidth="+IntegerToString(width);

//--- 写下交易品种名称
   comm="\r\n"+symbol+comm;

//--- 使用注释在图表上显示信息
   Comment(comm);
  }
2
3
4
5
6
7
8
9
10
11
12
13
14
15
16
17
18
19
20
21
22
23
24
25
26
27
28
29
30
31
32
33
34
35
36
37
38
39
40
41
42
43
44
45
46
47
48
49
50
51
52
53
54
55
56
57
58
59
60
61
62
63
64
65
66
67
68
69
70
71
72
73
74
75
76
77
78
79
80
81
82
83
84
85
86
87
88
89
90
91
92
93
94
95
96
97
98
99
100
101
102
103
104
105
106
107
108
109
110
111
112
113
114
115
116
117
118
119
120
121
122
123
124
125
126
127
128
129
130
131
132
133
134
135
136
137
138
139
140
141
142
143
144
145
146
147
148
149
150
151
152
153
154
155
156
157
158
159
160
161
162
163
164
165
166
167
168
169
170
171
172
173
174
175
176
177
178
179
180
181
182
183
184
185
186
187
188
189
190
191
192
193
194
195
196
197
198
199
200
201
202
# 24.1.10 DRAW_CANDLES
DRAW_CANDLES 样式根据四个指标缓冲区的值来绘制日式K线图,包括开盘价,最高价,最低价和收盘价。它用于创建自定义指标的日式K线图,可以应用在单独的图表(副图)子窗口中 或/和 其它 金融工具(交易品种) 的主图表上(即叠加K线图表)。
日式K线图的颜色设置可以使用预编译器指令进行设置,并使用PlotIndexSetInteger()函数进行动态设置。绘图属性的动态变化允许“激活”指标,以便日式K线图的外观根据当前情况而改变。
该指标仅绘制那些设置了所有四个指标缓冲区的非空值的K线柱(意即 开盘价,最高价,最低价和收盘价都要有确定的值)。要指定应将哪个值视为“空”,请在PLOT_EMPTY_VALUE属性中设置此值:
//--- 0(空)值将不参与绘制
   PlotIndexSetDouble(index_of_plot_DRAW_CANDLES,PLOT_EMPTY_VALUE,0);
2
始终需要明确的填写指标缓冲区的值,在缓冲区中设置空值以跳过相对应的K线柱。
DRAW_CANDLES样式所需的缓冲区的数量是4。该样式的所有缓冲区都应该按照给定的顺序一个接一个地进行:即开盘价,最高价,最低价和收盘价。缓冲区不会只包含空值,因为在这种情况下,不会绘制任何图形。
您可以为DRAW_CANDLES 样式设置三种颜色来影响蜡烛图的视觉效果。如果只设置一种颜色,那么它将会应用于图表上的所有蜡烛图。
//--- 将单一颜色的相同蜡烛图应用于它们
#property indicator_label1  "One color candles"
#property indicator_type1   DRAW_CANDLES
//--- 仅指定一种颜色,因此所有蜡烛图都是相同颜色
#property indicator_color1  clrGreen
2
3
4
5
如果用逗号分隔指定两种颜色,那么第一种颜色会被应用于蜡烛图外框,而第二种颜色则应用于蜡烛实体。
//--- 不同颜色的蜡烛图和烛芯
#property indicator_label1  "Two color candles"
#property indicator_type1   DRAW_CANDLES
//--- 绿色应用于烛芯和外框,而白色应用于主体
#property indicator_color1  clrGreen,clrWhite
2
3
4
5
如果用逗号分隔指定三种颜色,那么 上升 和 下降 的蜡烛图可以显示不同的颜色。在这种情况下,第一种颜色应用于蜡烛图的外框,而第二种和第三种颜色 —— 应用于牛市蜡烛(阳烛)图 和 熊市蜡烛(阴烛)图。
//--- 不同颜色的蜡烛图和烛芯
#property indicator_label1  "One color candles"
#property indicator_type1   DRAW_CANDLES
//--- 烛芯和外框是绿色,牛市蜡烛图的主体是白色,而熊市蜡烛图的主体是红色
#property indicator_color1  clrGreen,clrWhite,clrRed
2
3
4
5
因此,DRAW_CANDLES 样式允许您创建定制的颜色选项的蜡烛图。除此之外,在使用PlotIndexSetInteger函数进行指标操作期间还可以更改所有颜色(composition_index_DRAW_CANDLES, PLOT_LINE_COLOR, modifier_index, color),在这里 modifier_index 可能是以下的值: • 0 —— 外框和实体的颜色 • 1 —— 牛市蜡烛图实体颜色 • 2 —— 熊市蜡烛图实体颜色
//--- 设置外框和烛芯的颜色
PlotIndexSetInteger(0,PLOT_LINE_COLOR,0,clrBlue);
//--- 设置牛市蜡烛图主体颜色
PlotIndexSetInteger(0,PLOT_LINE_COLOR,1,clrGreen);
//--- 设置熊市蜡烛图主体颜色
PlotIndexSetInteger(0,PLOT_LINE_COLOR,2,clrRed);
2
3
4
5
6
指标示例:在单独(副图)窗口中,为选定的 金融工具(交易品种) 绘制日式蜡烛图。蜡烛图颜色每N 个跳价之后都会随机变化一次。N参数设置为指标的外部参数,即表示手动配置成为可能(在指标属性窗口-->参数 标签中)。

//+------------------------------------------------------------------+
//|                                                 DRAW_CANDLES.mq5 |
//|                        Copyright 2011, MetaQuotes Software Corp. |
//|                                             https://www.mql5.com |
//+------------------------------------------------------------------+
#property copyright "Copyright 2011, MetaQuotes Software Corp."
#property link      "https://www.mql5.com"
#property version   "1.00"

#property description "An indicator to demonstrate DRAW_CANDLES."
#property description "It draws candlesticks of a selected symbol in a separate window"
#property description " "
#property description "The color and width of candlesticks, as well as the symbol are changed"
#property description "randomly every N ticks"

#property indicator_separate_window
#property indicator_buffers 4
#property indicator_plots   1
//--- 标图柱形
#property indicator_label1  "DRAW_CANDLES1"
#property indicator_type1   DRAW_CANDLES
#property indicator_color1  clrGreen
#property indicator_style1  STYLE_SOLID
#property indicator_width1  1

//--- 输入参数
input int      N=5;              // 改变类型的订单号数量
input int      bars=500;         // 显示的柱形数量
input bool     messages=false;   // 在"EA交易"日志显示信息
//--- 指标缓冲区
double         Candle1Buffer1[];
double         Candle1Buffer2[];
double         Candle1Buffer3[];
double         Candle1Buffer4[];
//--- 交易品种名称
string symbol;
//--- 存储颜色的数组0到5的
color colors[]={clrRed,clrBlue,clrGreen,clrPurple,clrBrown,clrIndianRed};
//+------------------------------------------------------------------+
//| 自定义指标初始化函数                                                |
//+------------------------------------------------------------------+
int OnInit()
  {
//--- 如果柱形非常小 - 提前完成工作
   if(bars<50)
     {
      Comment("Please specify a larger number of bars! The operation of the indicator has been terminated");
      return(INIT_PARAMETERS_INCORRECT);
     }
//--- 指标缓冲区映射
   SetIndexBuffer(0,Candle1Buffer1,INDICATOR_DATA);
   SetIndexBuffer(1,Candle1Buffer2,INDICATOR_DATA);
   SetIndexBuffer(2,Candle1Buffer3,INDICATOR_DATA);
   SetIndexBuffer(3,Candle1Buffer4,INDICATOR_DATA);
//--- 空值
   PlotIndexSetDouble(0,PLOT_EMPTY_VALUE,0);
//--- 绘制柱形的交易品种名称
   symbol=_Symbol;
//--- 设置交易品种的展示
   PlotIndexSetString(0,PLOT_LABEL,symbol+" Open;"+symbol+" High;"+symbol+" Low;"+symbol+" Close");
   IndicatorSetString(INDICATOR_SHORTNAME,"DRAW_CANDLES("+symbol+")");
//---
   return(INIT_SUCCEEDED);
  }
//+------------------------------------------------------------------+
//| 自定义指标迭代函数                                                  |
//+------------------------------------------------------------------+
int OnCalculate(const int rates_total,
                const int prev_calculated,
                const datetime &time[],
                const double &open[],
                const double &high[],
                const double &low[],
                const double &close[],
                const long &tick_volume[],
                const long &volume[],
                const int &spread[])
  {
   static int ticks=INT_MAX-100;
//--- 计算订单号改变样式,颜色和线型宽度
   ticks++;
//--- 如果足够数量的订单号被积累
   if(ticks>=N)
     {
      //--- 选择来自市场报价窗口的新交易品种
      symbol=GetRandomSymbolName();
      //--- 改变格式
      ChangeLineAppearance();
      //--- 选择来自市场报价窗口的新交易品种
      int tries=0;
      //--- 试图5 次填充缓冲区plot1的交易品种价格
      while(!CopyFromSymbolToBuffers(symbol,rates_total,0,
            Candle1Buffer1,Candle1Buffer2,Candle1Buffer3,Candle1Buffer4)
            && tries<5)
        {
         //--- CopyFromSymbolToBuffers() 函数调用的计数器
         tries++;
        }
      //--- 重置0计数器
      ticks=0;
     }
//--- 返回 prev_calculated值以便下次调用函数
   return(rates_total);
  }
//+------------------------------------------------------------------+
//| 填充指定蜡烛图                                                     |
//+------------------------------------------------------------------+
bool CopyFromSymbolToBuffers(string name,
                             int total,
                             int plot_index,
                             double &buff1[],
                             double &buff2[],
                             double &buff3[],
                             double &buff4[]
                             )
  {
//--- 在rates[] 数组中,我们将复制开盘价,最高价,最低价和收盘价
   MqlRates rates[];
//--- 尝试计数器
   int attempts=0;
//--- 已复制多少
   int copied=0;
//--- 试图25次获得所需交易品种的时间帧
   while(attempts<25 && (copied=CopyRates(name,_Period,0,bars,rates))<0)
     {
      Sleep(100);
      attempts++;
      if(messages) PrintFormat("%s CopyRates(%s) attempts=%d",__FUNCTION__,name,attempts);
     }
//--- 如果复制足够数量的柱形失败
   if(copied!=bars)
     {
      //--- 形成信息字符串
      string comm=StringFormat("For the symbol %s, managed to receive only %d bars of %d requested ones",
                               name,
                               copied,
                               bars
                               );
      //--- 在主图表窗口的注释中显示信息
      Comment(comm);
      //--- 显示信息
      if(messages) Print(comm);
      return(false);
     }
   else
     {
      //--- 设置交易品种的展示
      PlotIndexSetString(plot_index,PLOT_LABEL,name+" Open;"+name+" High;"+name+" Low;"+name+" Close");
     }
//--- 初始化空值缓冲区
   ArrayInitialize(buff1,0.0);
   ArrayInitialize(buff2,0.0);
   ArrayInitialize(buff3,0.0);
   ArrayInitialize(buff4,0.0);
//--- 在每个订单号上复制缓冲区价格
   for(int i=0;i<copied;i++)
     {
      //--- 计算缓冲区相应的标引
      int buffer_index=total-copied+i;
      //--- 写下缓冲区的价格
      buff1[buffer_index]=rates[i].open;
      buff2[buffer_index]=rates[i].high;
      buff3[buffer_index]=rates[i].low;
      buff4[buffer_index]=rates[i].close;
     }
   return(true);
  }
//+------------------------------------------------------------------+
//| 随机返回来自市场报价的交易品种                                       |
//+------------------------------------------------------------------+
string GetRandomSymbolName()
  {
//--- 市场报价窗口中显示的交易品种数量
   int symbols=SymbolsTotal(true);
//--- 列表中的交易品种位置 - 从0到交易品种的随机号
   int number=MathRand()%symbols;
//--- 返回指定位置的交易品种名称
   return SymbolName(number,true);
  }
//+------------------------------------------------------------------+
//| 改变柱形的外观                                                     |
//+------------------------------------------------------------------+
void ChangeLineAppearance()
  {
//--- 形成柱形属性信息的字符串
   string comm="";
//---改变柱形颜色的模块
   int number=MathRand(); // 获得随机数
//--- 除数等于colors[]数组的大小
   int size=ArraySize(colors);
//--- 获得选择新颜色作为整数除法余数的标引
   int color_index=number%size;
//--- 设置颜色为 PLOT_LINE_COLOR 属性
   PlotIndexSetInteger(0,PLOT_LINE_COLOR,colors[color_index]);
//--- 写下颜色
   comm=comm+"\r\n"+(string)colors[color_index];
//--- 写下交易品种名称
   comm="\r\n"+symbol+comm;
//--- 使用注释在图表上显示信息
   Comment(comm);
  }
2
3
4
5
6
7
8
9
10
11
12
13
14
15
16
17
18
19
20
21
22
23
24
25
26
27
28
29
30
31
32
33
34
35
36
37
38
39
40
41
42
43
44
45
46
47
48
49
50
51
52
53
54
55
56
57
58
59
60
61
62
63
64
65
66
67
68
69
70
71
72
73
74
75
76
77
78
79
80
81
82
83
84
85
86
87
88
89
90
91
92
93
94
95
96
97
98
99
100
101
102
103
104
105
106
107
108
109
110
111
112
113
114
115
116
117
118
119
120
121
122
123
124
125
126
127
128
129
130
131
132
133
134
135
136
137
138
139
140
141
142
143
144
145
146
147
148
149
150
151
152
153
154
155
156
157
158
159
160
161
162
163
164
165
166
167
168
169
170
171
172
173
174
175
176
177
178
179
180
181
182
183
184
185
186
187
188
189
190
191
192
193
194
195
196
197
198
199
200
201
# 24.1.11 DRAW_COLOR_LINE
样式DRAW_COLOR_LINE 其实是DRAW_LINE 样式的彩色变体;它也使用指标缓冲区的值绘制直线。但是该样式,如标识符中带有COLOR单词的所有彩色样式一样,还有一个额外的特殊的指标缓冲区,用于存储来自特定颜色数组的颜色索引编号(数字)。因此,在K线图表上绘制直线时,可以通过指定颜色索引号来定义每个线段的颜色。
直线的宽度,线型和颜色可以使用预编译器指令进行设置 和/或 使用PlotIndexSetInteger()函数进行动态设置。绘图属性的动态变化允许“激活”指标,以便于可以根据当前状况改变其外观。
标图DRAW_COLOR_LINE 所需的缓冲区数量是 2。 • 一个缓冲区用于存储绘制直线的指标值; • 一个缓冲区用于存储对应每根K线柱的直线的颜色索引编号。
颜色可以通过预编译程序指令 #property indicator_color1指定,以逗号分隔。颜色数量不能超过64种。
//--- 定义5种用于填充每个柱形的颜色(它们存储在指定数组)
#property indicator_color1  clrRed,clrBlue,clrGreen,clrOrange,clrDeepPink // (最多64种颜色)
2
指标示例:使用K线柱收盘价绘制直线。直线的 宽度 和 线型 每N=5跳价之后都会随机变化一次。

线段颜色在自定义函数ChangeColors()也会随机变化。
//+------------------------------------------------------------------+
//| 改变线段颜色                                                       |
//+------------------------------------------------------------------+
void  ChangeColors(color  &cols[],int plot_colors)
  {
//--- 颜色数
   int size=ArraySize(cols);
//---
   string comm=ChartGetString(0,CHART_COMMENT)+"\r\n\r\n";

//--- 为每个颜色索引随机定义一个新的颜色
   for(int plot_color_ind=0;plot_color_ind<plot_colors;plot_color_ind++)
     {
      //--- 获得随机数
      int number=MathRand();
      //--- 获得col[]数组的标引作为整数除法的余数
      int i=number%size;
      //--- 设置每个标引的颜色为 PLOT_LINE_COLOR属性
      PlotIndexSetInteger(0,                    //  图形样式数量
                          PLOT_LINE_COLOR,      //  属性标识符
                          plot_color_ind,       //  颜色标引,我们在这里编写颜色
                          cols[i]);             // 新颜色
      //--- 编写颜色
      comm=comm+StringFormat("LineColorIndex[%d]=%s \r\n",plot_color_ind,ColorToString(cols[i],true));
      ChartSetString(0,CHART_COMMENT,comm);
     }
//---
  }
2
3
4
5
6
7
8
9
10
11
12
13
14
15
16
17
18
19
20
21
22
23
24
25
26
27
28
该示例显示了指标"彩色(color)"版的特点 —— 想要改变线段的颜色,您无需改变ColorLineColors[]缓冲区的值(其中包含颜色索引)。您所需要做的只是在一个特定的数组中设置新的颜色。这使您可以快速的更改整个样式的颜色,使用PlotIndexSetInteger()函数只能更改一小段颜色。
请注意,最初DRAW_COLOR_LIN样式的 属性 是使用编译程序指令 #property设置的,然后在 OnCalculate() 函数中对这三种属性随机设置。
参数 N 和 Length (Length表示线段的长度对应几根K线柱,N 表示几次跳价之后改变一次颜色)设置为指标的外部参数,即表示手动配置成为可能(在指标属性窗口-->参数 标签中)。
//+------------------------------------------------------------------+
//|                                              DRAW_COLOR_LINE.mq5 |
//|                        Copyright 2011, MetaQuotes Software Corp. |
//|                                             https://www.mql5.com |
//+------------------------------------------------------------------+
#property copyright "Copyright 2011, MetaQuotes Software Corp."
#property link      "https://www.mql5.com"
#property version   "1.00"

#property description "An indicator to demonstrate DRAW_COLOR_LINE"
#property description "It draws a line on Close price in colored pieces of 20 bars each"
#property description "The width, style and color of the line parts are changed randomly"
#property description "every N ticks"

#property indicator_chart_window
#property indicator_buffers 2
#property indicator_plots   1
//--- 标图 ColorLine
#property indicator_label1  "ColorLine"
#property indicator_type1   DRAW_COLOR_LINE
//--- 定义5种用于填充每个柱形的颜色(它们存储在指定数组)
#property indicator_color1  clrRed,clrBlue,clrGreen,clrOrange,clrDeepPink // (Up to 64 colors can be specified)
#property indicator_style1  STYLE_SOLID
#property indicator_width1  1
//--- 输入参数
input int      N=5;           // 改变订单号数量
input int      Length=20;     // 柱形每个颜色部分的长度
int            line_colors=5; // 设置颜色数量是 5 - 见 #property indicator_color1
//--- 标图缓冲区
double         ColorLineBuffer[];
//--- 存储每柱线型颜色的缓冲区
double         ColorLineColors[];

//--- 存储颜色的数组包含7种元素
color colors[]={clrRed,clrBlue,clrGreen,clrChocolate,clrMagenta,clrDodgerBlue,clrGoldenrod};
//--- 存储线型样式的数组
ENUM_LINE_STYLE styles[]={STYLE_SOLID,STYLE_DASH,STYLE_DOT,STYLE_DASHDOT,STYLE_DASHDOTDOT};
//+------------------------------------------------------------------+
//| 自定义指标初始化函数                                                |
//+------------------------------------------------------------------+
int OnInit()
  {
//--- 绑定数组和指标缓冲区
   SetIndexBuffer(0,ColorLineBuffer,INDICATOR_DATA);
   SetIndexBuffer(1,ColorLineColors,INDICATOR_COLOR_INDEX);
//--- 初始化随机数生成器
   MathSrand(GetTickCount());
//---
   return(INIT_SUCCEEDED);
  }
//+------------------------------------------------------------------+
//| 自定义指标迭代函数                                                 |
//+------------------------------------------------------------------+
int OnCalculate(const int rates_total,
                const int prev_calculated,
                const datetime &time[],
                const double &open[],
                const double &high[],
                const double &low[],
                const double &close[],
                const long &tick_volume[],
                const long &volume[],
                const int &spread[])
  {
   static int ticks=0;
//--- 计算订单号改变样式,颜色和线型宽度
   ticks++;
//--- 如果订单号的临界值被积累
   if(ticks>=N)
     {
      //--- 改变线型属性
      ChangeLineAppearance();
      //--- 改变线型部分的颜色
      ChangeColors(colors,5);
      //--- 重置0计数器
      ticks=0;
     }

//--- 计算指标值的模块
   for(int i=0;i<rates_total;i++)
     {
      //--- 指标值写入缓冲区
      ColorLineBuffer[i]=close[i];
      //--- 现在,为该柱随机设置颜色标引
      int color_index=i%(5*Length);
      color_index=color_index/Length;
      //--- 对于该柱,线型将具有color_index标引的颜色
      ColorLineColors[i]=color_index;
     }

//--- 返回prev_calculated值以便下次调用函数
   return(rates_total);
  }
//+------------------------------------------------------------------+
//| 改变线段颜色                                                       |
//+------------------------------------------------------------------+
void  ChangeColors(color  &cols[],int plot_colors)
  {
//--- 颜色数
   int size=ArraySize(cols);
//---
   string comm=ChartGetString(0,CHART_COMMENT)+"\r\n\r\n";

//--- 为每个颜色标引随机定义一个新的颜色
   for(int plot_color_ind=0;plot_color_ind<plot_colors;plot_color_ind++)
     {
      //--- 获得随机数
      int number=MathRand();
      //--- 获得col[]数组的标引作为整数除法的余数
      int i=number%size;
      //--- 设置每个标引的颜色为 PLOT_LINE_COLOR属性
      PlotIndexSetInteger(0,                    //  图形样式数量
                          PLOT_LINE_COLOR,      //  属性标识符
                          plot_color_ind,       //  颜色标引,我们在这里编写颜色
                          cols[i]);             //  新颜色
      //--- 编写颜色
      comm=comm+StringFormat("LineColorIndex[%d]=%s \r\n",plot_color_ind,ColorToString(cols[i],true));
      ChartSetString(0,CHART_COMMENT,comm);
     }
//---
  }
//+------------------------------------------------------------------+
//| 改变指标的线型显示外观                                              |
//+------------------------------------------------------------------+
void ChangeLineAppearance()
  {
//--- 形成线型属性信息的字符串
   string comm="";
//--- 改变线型宽度的模块
   int number=MathRand();
//--- 获得整数除法余数的宽度
   int width=number%5; // 宽度设置从 0 到 4
//--- 设置颜色为PLOT_LINE_WIDTH属性
   PlotIndexSetInteger(0,PLOT_LINE_WIDTH,width);
//--- 写下线型宽度
   comm=comm+" Width="+IntegerToString(width);

//--- 改变线型样式的模块
   number=MathRand();
//--- 除数等于样式数组的大小
   int size=ArraySize(styles);
//--- 获得选择新样式作为整数除法余数的标引
   int style_index=number%size;
//--- 设置颜色为 PLOT_LINE_COLOR 属性
   PlotIndexSetInteger(0,PLOT_LINE_STYLE,styles[style_index]);
//--- 写下线型样式
   comm=EnumToString(styles[style_index])+", "+comm;
//--- 使用注释在图表上显示信息
   Comment(comm);
  }
2
3
4
5
6
7
8
9
10
11
12
13
14
15
16
17
18
19
20
21
22
23
24
25
26
27
28
29
30
31
32
33
34
35
36
37
38
39
40
41
42
43
44
45
46
47
48
49
50
51
52
53
54
55
56
57
58
59
60
61
62
63
64
65
66
67
68
69
70
71
72
73
74
75
76
77
78
79
80
81
82
83
84
85
86
87
88
89
90
91
92
93
94
95
96
97
98
99
100
101
102
103
104
105
106
107
108
109
110
111
112
113
114
115
116
117
118
119
120
121
122
123
124
125
126
127
128
129
130
131
132
133
134
135
136
137
138
139
140
141
142
143
144
145
146
147
148
149
150
# 24.1.12 DRAW_COLOR_SECTION
样式DRAW_COLOR_SECTION是 DRAW_SECTION样式的彩色版,但与后者又不太相同,它允许绘制不同颜色的线段。DRAW_COLOR_SECTION样式, 如标识符中带有COLOR单词的所有彩色样式一样,还有一个额外的特殊的指标缓冲区,用于存储来自特定颜色数组的颜色索引编号(数字)。因此,可以通过指定对应于 线段结尾 的K线柱的索引号,和 颜色索引号 来定义每个线段的颜色。
线段的宽度,颜色和线型的指定类似 DRAW_SECTION 样式 —— 可以使用预编译器指令进行设置 和/或 使用PlotIndexSetInteger()函数进行动态设置。绘图属性的动态变化允许“激活”指标,以便于可以根据当前状况改变其外观。
绘制线段是从一个缓冲区的非空值 到 另一个指标缓冲区的非空值 ,忽略空值。若要指定哪个值应被视为“空”,请在 PLOT_EMPTY_VALUE 属性设定该值。例:如果指标应该为非零值绘制一系列的线段,那么您需要设置 零 值为 “空” 值:
//--- 0(空)值将不参与绘制
   PlotIndexSetDouble(index_of_plot_DRAW_COLOR_SECTION,PLOT_EMPTY_VALUE,0);
2
始终需要明确的填写指标缓冲区的值,在缓冲区中给不应绘制的元素设置一个 空 值。
样式 DRAW_COLOR_SECTION 所需的缓冲区的数量是2。 • 一个缓冲区用于存储绘制线段的指标值; • 一个缓冲区用于存储颜色索引,它被用于绘制线段(它使得仅设置非空值有意义)。
颜色可以通过预编译程序指令 #property indicator_color1指定,以逗号分隔。颜色数量不能超过64种。
指标示例:取 最高价 的值,每5根K线柱绘制一根字段。线段的颜色,宽度和样式每N 次跳价之后都会随机变化一次。

请注意,最初DRAW_COLOR_SECTION样式的 属性 中,定义了8种颜色,这时是使用编译程序指令 #property设置的,然后在 OnCalculate() 函数中,颜色 是从数组colors[] 中随机设置的。
参数 N 为指标的外部参数,即表示手动配置成为可能(在指标属性窗口-->参数 标签中)。
//+------------------------------------------------------------------+
//|                                           DRAW_COLOR_SECTION.mq5 |
//|                        Copyright 2011, MetaQuotes Software Corp. |
//|                                             https://www.mql5.com |
//+------------------------------------------------------------------+
#property copyright "Copyright 2011, MetaQuotes Software Corp."
#property link      "https://www.mql5.com"
#property version   "1.00"

#property description "An indicator to demonstrate DRAW_COLOR_SECTION"
#property description "It draws colored sections with the length equal to the specified number of bars"
#property description "The color, width and style of sections are changed randomly"
#property description "after every N ticks"

#property indicator_chart_window
#property indicator_buffers 2
#property indicator_plots   1
//--- 标图ColorSection
#property indicator_label1  "ColorSection"
#property indicator_type1   DRAW_COLOR_SECTION
//--- 定义8 种用于填充节段的颜色(它们存储在指定数组)
#property indicator_color1  clrRed,clrGold,clrMediumBlue,clrLime,clrMagenta,clrBrown,clrTan,clrMediumVioletRed
#property indicator_style1  STYLE_SOLID
#property indicator_width1  1
//--- 输入参数
input int      N=5;                      // 改变订单号数量
input int      bars_in_section=5;        // 柱形节段的长度
//--- 计算节段终端的辅助变量
int            divider;
int            color_sections;
//--- 标图缓冲区
double         ColorSectionBuffer[];
//--- 存储每柱线型颜色的缓冲区
double         ColorSectionColors[];
//--- 存储颜色的数组包含14种元素
color colors[]=
  {
   clrRed,clrBlue,clrGreen,clrChocolate,clrMagenta,clrDodgerBlue,clrGoldenrod,
   clrIndigo,clrLightBlue,clrAliceBlue,clrMoccasin,clrWhiteSmoke,clrCyan,clrMediumPurple
  };
//--- 存储线型样式的数组
ENUM_LINE_STYLE styles[]={STYLE_SOLID,STYLE_DASH,STYLE_DOT,STYLE_DASHDOT,STYLE_DASHDOTDOT};
//+------------------------------------------------------------------+
//| 自定义指标初始化函数                                                |
//+------------------------------------------------------------------+
int OnInit()
  {
//--- 指标缓冲区映射
   SetIndexBuffer(0,ColorSectionBuffer,INDICATOR_DATA);
   SetIndexBuffer(1,ColorSectionColors,INDICATOR_COLOR_INDEX);
//--- 0(空)值将不参与绘制
   PlotIndexSetDouble(0,PLOT_EMPTY_VALUE,0);
//---- 为节段填充颜色的颜色数量
   int color_sections=8;   // 请见注释#property indicator_color1
//--- 检查指标参数
   if(bars_in_section<=0)
     {
      PrintFormat("Invalid section length=%d",bars_in_section);
      return(INIT_PARAMETERS_INCORRECT);
     }
   else divider=color_sections*bars_in_section;
//---
   return(INIT_SUCCEEDED);
  }
//+------------------------------------------------------------------+
//| 自定义指标迭代函数                                                 |
//+------------------------------------------------------------------+
int OnCalculate(const int rates_total,
                const int prev_calculated,
                const datetime &time[],
                const double &open[],
                const double &high[],
                const double &low[],
                const double &close[],
                const long &tick_volume[],
                const long &volume[],
                const int &spread[])
  {
   static int ticks=0;
//--- 计算订单号改变样式,颜色和线型宽度
   ticks++;
//--- 如果订单号的临界值被积累
   if(ticks>=N)
     {
      //--- 改变线型属性
      ChangeLineAppearance();
      //--- 改变用于标图节段的颜色
      ChangeColors(colors,color_sections);
      //--- 重置0计数器
      ticks=0;
     }

//--- 指标值计算开始的柱形数
   int start=0;
//--- 如果之前计算了指标,那么在前一柱开始设置
   if(prev_calculated>0) start=prev_calculated-1;
//--- 这是指标值的全部计算
   for(int i=start;i<rates_total;i++)
     {
      //--- 如果柱数可被section_length整除,它意味着这是节段的终点
      if(i%bars_in_section==0)
        {
         //--- 在该柱最高价设置节段终点
         ColorSectionBuffer[i]=high[i];
         //--- 柱数除以 section_length*number_of_colors的余数
         int rest=i%divider;
         //获得颜色数 =  从 0 到 number_of_colors-1
         int color_indext=rest/bars_in_section;
         ColorSectionColors[i]=color_indext;
        }
      //---如果除法的余数等于柱数,
      else
        {
         //--- 如果什么也没发生,忽略柱形 - 设置0
         else ColorSectionBuffer[i]=0;
        }
     }
//--- 返回prev_calculated值以便下次调用函数
   return(rates_total);
  }
//+------------------------------------------------------------------+
//| 改变线段颜色                                                       |
//+------------------------------------------------------------------+
void  ChangeColors(color  &cols[],int plot_colors)
  {
//--- 颜色数
   int size=ArraySize(cols);
//---
   string comm=ChartGetString(0,CHART_COMMENT)+"\r\n\r\n";

//--- 为每个颜色标引随机定义一个新的颜色
   for(int plot_color_ind=0;plot_color_ind<plot_colors;plot_color_ind++)
     {
      //--- 获得随机数
      int number=MathRand();
      //--- 获得col[]数组的标引作为整数除法的余数
      int i=number%size;
      //--- 设置每个标引的颜色为 PLOT_LINE_COLOR属性
      PlotIndexSetInteger(0,                    //  图形样式数量
                          PLOT_LINE_COLOR,      //  属性标识符
                          plot_color_ind,       //  颜色标引,我们在这里编写颜色
                          cols[i]);             //  新颜色
      //--- 编写颜色
      comm=comm+StringFormat("SectionColorIndex[%d]=%s \r\n",plot_color_ind,ColorToString(cols[i],true));
      ChartSetString(0,CHART_COMMENT,comm);
     }
//---
  }
//+------------------------------------------------------------------+
//| 改变指标的线型显示外观                                              |
//+------------------------------------------------------------------+
void ChangeLineAppearance()
  {
//--- 形成线型属性信息的字符串
   string comm="";
//--- 改变线型宽度的模块
   int number=MathRand();
//--- 获得整数除法余数的宽度
   int width=number%5; // 宽度设置从 0 到 4
//--- 设置颜色为PLOT_LINE_WIDTH属性
   PlotIndexSetInteger(0,PLOT_LINE_WIDTH,width);
//--- 写下线型宽度
   comm=comm+" Width="+IntegerToString(width);

//--- 改变线型样式的模块
   number=MathRand();
//--- 除数等于样式数组的大小
   int size=ArraySize(styles);
//--- 获得选择新样式作为整数除法余数的标引
   int style_index=number%size;
//--- 设置颜色为 PLOT_LINE_COLOR 属性
   PlotIndexSetInteger(0,PLOT_LINE_STYLE,styles[style_index]);
//--- 写下线型样式
   comm=EnumToString(styles[style_index])+", "+comm;
//--- 使用注释在图表上显示信息
   Comment(comm);
  }
2
3
4
5
6
7
8
9
10
11
12
13
14
15
16
17
18
19
20
21
22
23
24
25
26
27
28
29
30
31
32
33
34
35
36
37
38
39
40
41
42
43
44
45
46
47
48
49
50
51
52
53
54
55
56
57
58
59
60
61
62
63
64
65
66
67
68
69
70
71
72
73
74
75
76
77
78
79
80
81
82
83
84
85
86
87
88
89
90
91
92
93
94
95
96
97
98
99
100
101
102
103
104
105
106
107
108
109
110
111
112
113
114
115
116
117
118
119
120
121
122
123
124
125
126
127
128
129
130
131
132
133
134
135
136
137
138
139
140
141
142
143
144
145
146
147
148
149
150
151
152
153
154
155
156
157
158
159
160
161
162
163
164
165
166
167
168
169
170
171
172
173
174
175
176
177
# 24.1.13 DRAW_COLOR_HISTOGRAM
DRAW_COLOR_HISTOGRAM样式 根据 从0 到 指定值 绘制一个彩色的柱状线。指定值 来自 指标缓冲区。每根柱状线都有其来自预设定颜色的自己的颜色。
柱状线的宽度,颜色和线型的设置类似 DRAW_HISTOGRAM 样式 —— 可以使用预编译器指令进行设置 和/或 使用PlotIndexSetInteger()函数进行动态设置。绘图属性的动态变化允许“激活”指标,以便于可以根据当前状况改变其外观。
由于每根柱状线都是从0开始水平绘制,因此DRAW_COLOR_HISTOGRAM 应该更好的应用在单独的图表(副图)窗口中。大多数情况下,这种 绘制样式 用于创建oscillator类型的指标,例如,Awesome Oscillator 或 Market Facilitation Index。对于不需要显示的空值,应指定 零 值。
样式DRAW_COLOR_HISTOGRAM 所需的缓冲区的数量是2。 • 一个缓冲区用于存储对应每根柱状线垂直方向上的长度,应该为非0值。柱状线的另一端应该始终为 0; • 一个缓冲区存储颜色索引,它被用于绘制线段(它使得仅设置非空值有意义)。
颜色可以通过预编译程序指令 #property indicator_color1指定,以逗号分隔。颜色数量不能超过64种。
指标示例:基于MathSin()绘制指定颜色的正弦曲线。所有柱状线的颜色,宽度和线型在每 N个跳价之后都会随机变化一次。参数bar指定正弦曲线的周期,经过了bar指定的K线柱数量之后,正弦曲线将重复这个循环。

请注意,最初DRAW_COLOR_HISTOGRAM样式的 属性 中,定义了8种颜色,这时是使用编译程序指令 #property设置的,然后在 OnCalculate() 函数中,颜色 是从数组colors[] 中的14种颜色中随机设置的。参数 N 为指标的外部参数,即表示手动配置成为可能(在指标属性窗口-->参数 标签中)。
//+------------------------------------------------------------------+
//|                                         DRAW_COLOR_HISTOGRAM.mq5 |
//|                        Copyright 2011, MetaQuotes Software Corp. |
//|                                             https://www.mql5.com |
//+------------------------------------------------------------------+
#property copyright "Copyright 2011, MetaQuotes Software Corp."
#property link      "https://www.mql5.com"
#property version   "1.00"

#property description "An indicator to demonstrate DRAW_COLOR_HISTOGRAM"
#property description "It draws a sinusoid as a histogram in a separate window"
#property description "The color and width of columns are changed randomly"
#property description "after every N ticks"
#property description "The bars parameter sets the number of bars to repeat the sinusoid"

#property indicator_separate_window
#property indicator_buffers 2
#property indicator_plots   1
//--- 输入参数
input int      bars=30;          // 柱形的正弦曲线周期
input int      N=5;              // 改变直方图的订单号数量
//--- 标图 Color_Histogram
#property indicator_label1  "Color_Histogram"
#property indicator_type1   DRAW_COLOR_HISTOGRAM
//--- 定义8 种用于填充节段的颜色(它们存储在指定数组)
#property indicator_color1  clrRed,clrGreen,clrBlue,clrYellow,clrMagenta,clrCyan,clrMediumSeaGreen,clrGold
#property indicator_style1  STYLE_SOLID
#property indicator_width1  1
//--- 缓冲区的值
double         Color_HistogramBuffer[];
//--- 颜色标引缓冲区
double         Color_HistogramColors[];
//--- 获得2Pi角弧度的因素,当乘以柱的参数时
double         multiplier;
int            color_sections;
//--- 存储颜色的数组包含14种元素
color colors[]=
  {
   clrRed,clrBlue,clrGreen,clrChocolate,clrMagenta,clrDodgerBlue,clrGoldenrod,
   clrIndigo,clrLightBlue,clrAliceBlue,clrMoccasin,clrWhiteSmoke,clrCyan,clrMediumPurple
  };
//--- 存储线型样式的数组
ENUM_LINE_STYLE styles[]={STYLE_SOLID,STYLE_DASH,STYLE_DOT,STYLE_DASHDOT,STYLE_DASHDOTDOT};
//+------------------------------------------------------------------+
//| 自定义指标初始化函数                                                |
//+------------------------------------------------------------------+
int OnInit()
  {
//--- 指标缓冲区映射
   SetIndexBuffer(0,Color_HistogramBuffer,INDICATOR_DATA);
   SetIndexBuffer(1,Color_HistogramColors,INDICATOR_COLOR_INDEX);
//---- 为正弦曲线填充颜色的颜色数量
   color_sections=8;   //  请见注释#property indicator_color1
//--- 计算乘数
   if(bars>1)multiplier=2.*M_PI/bars;
   else
     {
      PrintFormat("Set the value of bars=%d greater than 1",bars);
      //--- 提前终止指标
      return(INIT_PARAMETERS_INCORRECT);
     }
//---
   return(INIT_SUCCEEDED);
  }
//+------------------------------------------------------------------+
//| 自定义指标迭代函数                                                 |
//+------------------------------------------------------------------+
int OnCalculate(const int rates_total,
                const int prev_calculated,
                const datetime &time[],
                const double &open[],
                const double &high[],
                const double &low[],
                const double &close[],
                const long &tick_volume[],
                const long &volume[],
                const int &spread[])
  {
   static int ticks=0;
//--- 计算订单号改变样式,颜色和线型宽度
   ticks++;
//--- 如果订单号的临界值被积累
   if(ticks>=N)
     {
      //--- 改变线型属性
      ChangeLineAppearance();
      //--- 改变直方图的颜色
      ChangeColors(colors,color_sections);
      //--- 重置0计数器
      ticks=0;
     }

//--- 计算指标值
   int start=0;
//---如果之前OnCalculate开始期间已经计算
   if(prev_calculated>0) start=prev_calculated-1; // 在倒数第二柱设置计算起点
//--- 填写指标缓冲区的值
   for(int i=start;i<rates_total;i++)
     {
      //--- 价值
      Color_HistogramBuffer[i]=sin(i*multiplier);
      //--- 颜色
      int color_index=i%(bars*color_sections);
      color_index/=bars;
      Color_HistogramColors[i]=color_index;
     }
//--- 返回prev_calculated值以便下次调用函数
   return(rates_total);
  }
//+------------------------------------------------------------------+
//| 改变线段颜色                                                       |
//+------------------------------------------------------------------+
void  ChangeColors(color  &cols[],int plot_colors)
  {
//--- 颜色数
   int size=ArraySize(cols);
//---
   string comm=ChartGetString(0,CHART_COMMENT)+"\r\n\r\n";

//--- 为每个颜色标引随机定义一个新的颜色
   for(int plot_color_ind=0;plot_color_ind<plot_colors;plot_color_ind++)
     {
      //--- 获得随机数
      int number=MathRand();
      //--- 获得col[]数组的标引作为整数除法的余数
      int i=number%size;
      //--- 设置每个标引的颜色为 PLOT_LINE_COLOR属性
      PlotIndexSetInteger(0,                    //  图形样式数量
                          PLOT_LINE_COLOR,      //  属性标识符
                          plot_color_ind,       //  颜色标引,我们在这里编写颜色
                          cols[i]);             //  新颜色
      //--- 编写颜色
      comm=comm+StringFormat("HistogramColorIndex[%d]=%s \r\n",plot_color_ind,ColorToString(cols[i],true));
      ChartSetString(0,CHART_COMMENT,comm);
     }
//---
  }
//+------------------------------------------------------------------+
//| 改变指标的线型显示外观                                              |
//+------------------------------------------------------------------+
void ChangeLineAppearance()
  {
//--- 形成线型属性信息的字符串
   string comm="";
//--- 改变线型宽度的模块
   int number=MathRand();
//--- 获得整数除法余数的宽度
   int width=number%5; // 宽度设置从 0 到 4
//--- 设置颜色为PLOT_LINE_WIDTH属性
   PlotIndexSetInteger(0,PLOT_LINE_WIDTH,width);
//--- 写下线型宽度
   comm=comm+" Width="+IntegerToString(width);

//--- 改变线型样式的模块
   number=MathRand();
//--- 除数等于样式数组的大小
   int size=ArraySize(styles);
//--- 获得选择新样式作为整数除法余数的标引
   int style_index=number%size;
//--- 设置颜色为 PLOT_LINE_COLOR 属性
   PlotIndexSetInteger(0,PLOT_LINE_STYLE,styles[style_index]);
//--- 写下线型样式
   comm=EnumToString(styles[style_index])+", "+comm;
//--- 使用注释在图表上显示信息
   Comment(comm);
  }
2
3
4
5
6
7
8
9
10
11
12
13
14
15
16
17
18
19
20
21
22
23
24
25
26
27
28
29
30
31
32
33
34
35
36
37
38
39
40
41
42
43
44
45
46
47
48
49
50
51
52
53
54
55
56
57
58
59
60
61
62
63
64
65
66
67
68
69
70
71
72
73
74
75
76
77
78
79
80
81
82
83
84
85
86
87
88
89
90
91
92
93
94
95
96
97
98
99
100
101
102
103
104
105
106
107
108
109
110
111
112
113
114
115
116
117
118
119
120
121
122
123
124
125
126
127
128
129
130
131
132
133
134
135
136
137
138
139
140
141
142
143
144
145
146
147
148
149
150
151
152
153
154
155
156
157
158
159
160
161
162
163
164
165
166
# 24.1.14 DRAW_COLOR_HISTOGRAM2
DRAW_HISTOGRAM2 样式根据 两个指标缓冲区的值绘制一根彩色的垂直的柱状线。但与单色DRAW_HISTOGRAM2不同,在该样式中每一根柱状线都有其来自预定义设置的颜色。所有线段值都从指标缓冲区获得。
柱状线的宽度,线型和颜色的指定类似 DRAW_HISTOGRAM2 样式 —— 可以使用预编译器指令进行设置 和/或 使用PlotIndexSetInteger()函数进行动态设置。绘图属性的动态变化允许“激活”指标,以便于可以根据当前状况改变其外观。
DRAW_COLOR_HISTOGRAM2 样式可以被用在单独的图表子窗口(副图窗口) 和 主窗口中。由于不绘制 空 值,因此指标缓冲区的所有值都需要明确的设定。缓冲区不通过空值初始化。
样式DRAW_COLOR_HISTOGRAM2 所需的缓冲区的数量是 3个: • 对应每根K线柱,存储垂直柱状线段的上下端,需要两个缓冲区; • 一个缓冲区用于存储颜色索引,它被用于绘制线段(它使得仅设置非空值有意义)。
指标示例:在 最高价 和 最低价 之间绘制指定颜色的柱状线。对于每个交易日,柱状线都有不同的颜色。柱状线每日颜色,宽度和线型每 N 个跳价之后都会随机变化一次。

请注意,最初DRAW_COLOR_HISTOGRAM2样式的 属性 中,定义了5种颜色,这时是使用编译程序指令 #property设置的,然后在 OnCalculate() 函数中,颜色 是从数组colors[] 中的14种颜色中随机设置的。
参数 N 为指标的外部参数,即表示手动配置成为可能(在指标属性窗口-->参数 标签中)。
//+------------------------------------------------------------------+
//|                                        DRAW_COLOR_HISTOGRAM2.mq5 |
//|                        Copyright 2011, MetaQuotes Software Corp. |
//|                                             https://www.mql5.com |
//+------------------------------------------------------------------+
#property copyright "Copyright 2011, MetaQuotes Software Corp."
#property link      "https://www.mql5.com"
#property version   "1.00"

#property description "An indicator to demonstrate DRAW_COLOR_HISTOGRAM2"
#property description "It draws a segment between Open and Close on each bar"
#property description "The color, width and style are changed randomly"
#property description "after every N ticks"

#property indicator_chart_window
#property indicator_buffers 3
#property indicator_plots   1
//--- 标图ColorHistogram_2
#property indicator_label1  "ColorHistogram_2"
#property indicator_type1   DRAW_COLOR_HISTOGRAM2
//--- 定义 5 种颜色用于为基于工作日的直方图填充颜色(它们存储在指定数组)
#property indicator_color1  clrRed,clrBlue,clrGreen,clrYellow,clrMagenta
#property indicator_style1  STYLE_SOLID
#property indicator_width1  1

//--- 输入参数
input int      N=5;              // 改变直方图的订单号数量
int            color_sections;
//--- 缓冲区值
double         ColorHistogram_2Buffer1[];
double         ColorHistogram_2Buffer2[];
//--- 颜色标引缓冲区
double         ColorHistogram_2Colors[];
//--- 存储颜色的数组包含14种元素
color colors[]=
  {
   clrRed,clrBlue,clrGreen,clrChocolate,clrMagenta,clrDodgerBlue,clrGoldenrod,
   clrIndigo,clrLightBlue,clrAliceBlue,clrMoccasin,clrWhiteSmoke,clrCyan,clrMediumPurple
  };
//--- 存储线型样式的数组
ENUM_LINE_STYLE styles[]={STYLE_SOLID,STYLE_DASH,STYLE_DOT,STYLE_DASHDOT,STYLE_DASHDOTDOT};
//+------------------------------------------------------------------+
//| 自定义指标初始化函数                                                |
//+------------------------------------------------------------------+
int OnInit()
  {
//--- 指标缓冲区映射
   SetIndexBuffer(0,ColorHistogram_2Buffer1,INDICATOR_DATA);
   SetIndexBuffer(1,ColorHistogram_2Buffer2,INDICATOR_DATA);
   SetIndexBuffer(2,ColorHistogram_2Colors,INDICATOR_COLOR_INDEX);
//--- 设置空值
   PlotIndexSetDouble(0,PLOT_EMPTY_VALUE,0);
//---- 为正弦曲线填充颜色的颜色数量
   color_sections=8;   // 请见注释#property indicator_color1
//---
   return(INIT_SUCCEEDED);
  }
//+------------------------------------------------------------------+
//| 自定义指标迭代函数                                                 |
//+------------------------------------------------------------------+
int OnCalculate(const int rates_total,
                const int prev_calculated,
                const datetime &time[],
                const double &open[],
                const double &high[],
                const double &low[],
                const double &close[],
                const long &tick_volume[],
                const long &volume[],
                const int &spread[])
  {
   static int ticks=0;
//--- 计算订单号改变样式,颜色和线型宽度
   ticks++;
//--- 如果订单号的临界值被积累
   if(ticks>=N)
     {
      //--- 改变线型属性
      ChangeLineAppearance();
      //--- 改变用于绘制直方图的颜色
      ChangeColors(colors,color_sections);
      //--- 重置0计数器
      ticks=0;
     }

//--- 计算指标值
   int start=0;
//--- 通过每柱的开盘价获得工作日
   MqlDateTime dt;
//---如果之前OnCalculate开始期间已经计算
   if(prev_calculated>0) start=prev_calculated-1; // 在倒数第二柱设置计算起点
//--- 填写指标缓冲区的值
   for(int i=start;i<rates_total;i++)
     {
      TimeToStruct(time[i],dt);
      //--- 价值
      ColorHistogram_2Buffer1[i]=high[i];
      ColorHistogram_2Buffer2[i]=low[i];
      //--- 根据工作日设置颜色标引
      int day=dt.day_of_week;
      ColorHistogram_2Colors[i]=day;
     }
//--- 返回prev_calculated值以便下次调用函数
   return(rates_total);
  }
//+------------------------------------------------------------------+
//| 改变线段颜色                                                       |
//+------------------------------------------------------------------+
void  ChangeColors(color  &cols[],int plot_colors)
  {
//--- 颜色数
   int size=ArraySize(cols);
//---
   string comm=ChartGetString(0,CHART_COMMENT)+"\r\n\r\n";

//--- 为每个颜色标引随机定义一个新的颜色
   for(int plot_color_ind=0;plot_color_ind<plot_colors;plot_color_ind++)
     {
      //--- 获得随机数
      int number=MathRand();
      //--- 获得col[]数组的标引作为整数除法的余数
      int i=number%size;
      //--- 设置每个标引的颜色为 PLOT_LINE_COLOR属性
      PlotIndexSetInteger(0,                    //  图形样式数量
                          PLOT_LINE_COLOR,      //  属性标识符
                          plot_color_ind,       //  颜色标引,我们在这里编写颜色
                          cols[i]);             //  新颜色
      //--- 编写颜色
      comm=comm+StringFormat("HistogramColorIndex[%d]=%s \r\n",plot_color_ind,ColorToString(cols[i],true));
      ChartSetString(0,CHART_COMMENT,comm);
     }
//---
  }
//+------------------------------------------------------------------+
//| 改变指标的线型显示外观                                              |
//+------------------------------------------------------------------+
void ChangeLineAppearance()
  {
//--- 形成线型属性信息的字符串
   string comm="";
//--- 改变线型宽度的模块
   int number=MathRand();
//--- 获得整数除法余数的宽度
   int width=number%5; // 宽度设置从 0 到 4
//--- 设置颜色为PLOT_LINE_WIDTH属性
   PlotIndexSetInteger(0,PLOT_LINE_WIDTH,width);
//--- 写下线型宽度
   comm=comm+" Width="+IntegerToString(width);

//--- 改变线型样式的模块
   number=MathRand();
//--- 除数等于样式数组的大小
   int size=ArraySize(styles);
//--- 获得选择新样式作为整数除法余数的标引
   int style_index=number%size;
//--- 设置颜色为 PLOT_LINE_COLOR 属性
   PlotIndexSetInteger(0,PLOT_LINE_STYLE,styles[style_index]);
//--- 写下线型样式
   comm=EnumToString(styles[style_index])+", "+comm;
//--- 使用注释在图表上显示信息
   Comment(comm);
  }
2
3
4
5
6
7
8
9
10
11
12
13
14
15
16
17
18
19
20
21
22
23
24
25
26
27
28
29
30
31
32
33
34
35
36
37
38
39
40
41
42
43
44
45
46
47
48
49
50
51
52
53
54
55
56
57
58
59
60
61
62
63
64
65
66
67
68
69
70
71
72
73
74
75
76
77
78
79
80
81
82
83
84
85
86
87
88
89
90
91
92
93
94
95
96
97
98
99
100
101
102
103
104
105
106
107
108
109
110
111
112
113
114
115
116
117
118
119
120
121
122
123
124
125
126
127
128
129
130
131
132
133
134
135
136
137
138
139
140
141
142
143
144
145
146
147
148
149
150
151
152
153
154
155
156
157
158
159
160
161
162
# 24.1.15 DRAW_COLOR_ARROW
DRAW_COLOR_ARROW 样式根据指标缓冲区的值绘制彩色箭头( Wingdings字库中的符号)。 与DRAW_ARROW不同的是,在此样式中,可以通过indicator_color1属性为每个符号指定的预定义颜色集来设置颜色。
符号的宽度和颜色的设置类似 DRAW_ARROW 样式 —— 可以使用预编译器指令进行设置 和/或 使用PlotIndexSetInteger()函数进行动态设置。绘图属性的动态变化允许“激活”指标,以便于可以根据当前状况改变其外观。
符号使用PLOT_ARROW 属性进行设置。
//--- 定义PLOT_ARROW绘制的来自Wingdings字体的符号代码到
   PlotIndexSetInteger(0,PLOT_ARROW,code);
2
PLOT_ARROW的默认值=159 (一个圆圈)。
每个箭头实际上都是一个有 高度 和 定位锚点 的符号,可以包含图表上的一些重要信息(例如,柱形的收盘价)。因此,我们可以额外指定像素的垂直偏移距离,这并不依赖图表的比例。箭头沿着指定的像素数量将向下移动一段距离,同时指标的值会保持不变:
//--- 设置箭头的像素垂直移动
   PlotIndexSetInteger(0,PLOT_ARROW_SHIFT,shift);
2
PLOT_ARROW_SHIFT的负值意味着箭头向上楄移距离,正值表示箭头向下偏移距离。
DRAW_COLOR_ARROW 样式可以被用在单独的图表子窗口(副图) 和 主窗口 中。由于不绘制空值并且也不会出现在"数据窗口",指标缓冲区的所有值都应该明确设定。缓冲区不通过零值初始化。
//--- Set an empty value
   PlotIndexSetDouble(DRAW_COLOR_ARROW_plot_index,PLOT_EMPTY_VALUE,0);
2
样式DRAW_COLOR_ARROW所需的缓冲区的数量是2。 • 一个缓冲区存储价格值,它被用于绘制符号(PLOT_ARROW_SHIFT属性表示偏移距离,单位:像素); • 一个缓冲区存储颜色索引,它被用于绘制箭头(它使得仅设置非空值有意义)。
指标示例:如果当前K线柱的收盘价 大于 前一根K线柱的收盘价,则在当前K线 收盘价 的位置绘制一个箭头。所有箭头的宽度,偏移距离 和 符号代码在每 N 个跳价之后都会随机变化一次。符号的颜色取决于绘制它的K线柱数。
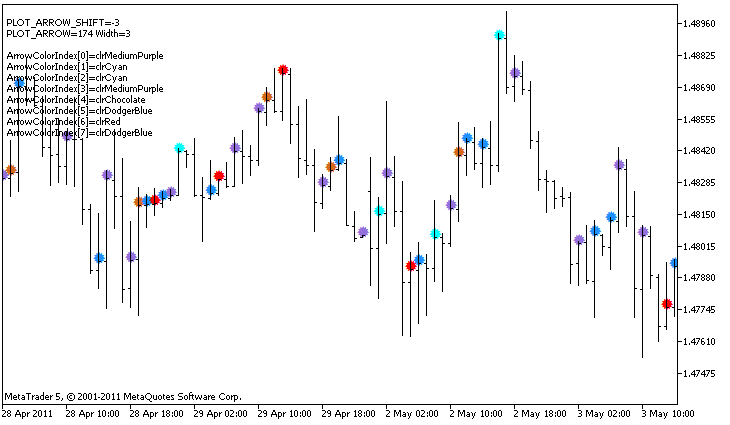
在示例中,对于DRAW_COLOR_ARROW的样式属性,颜色和大小是使用编译程序指令 #property设置的,然后在 OnCalculate() 函数随机设置属性。参数 N 为指标的外部参数,即表示手动配置成为可能(在指标属性窗口-->参数 标签中)。
请注意,最初DRAW_COLOR_ARROW样式的 属性 中,定义了8种颜色,这时是使用编译程序指令 #property设置的,然后在 OnCalculate() 函数中,颜色 是从数组colors[] 中的14种颜色中随机设置的。
//+------------------------------------------------------------------+
//|                                             DRAW_COLOR_ARROW.mq5 |
//|                        Copyright 2011, MetaQuotes Software Corp. |
//|                                             https://www.mql5.com |
//+------------------------------------------------------------------+
#property copyright "Copyright 2011, MetaQuotes Software Corp."
#property link      "https://www.mql5.com"
#property version   "1.00"

#property description "An indicator to demonstrate DRAW_COLOR_ARROW"
#property description "Draws different-color arrows set by Unicode characters, on a chart"
#property description "The color, size, shift and symbol code of the arrow are changed"
#property description " randomly every N ticks"
#property description "The code parameter sets the base value: code=159 (a circle)"

#property indicator_chart_window
#property indicator_buffers 2
#property indicator_plots   1
//--- 标图ColorArrow
#property indicator_label1  "ColorArrow"
#property indicator_type1   DRAW_COLOR_ARROW
//--- 定义 8 种颜色用于为基于工作日的直方图填充颜色(它们存储在指定数组)
#property indicator_color1  clrRed,clrBlue,clrSeaGreen,clrGold,clrDarkOrange,clrMagenta,clrYellowGreen,clrChocolate
#property indicator_style1  STYLE_SOLID
#property indicator_width1  1

//--- 输入参数
input int      N=5;         // 改变订单号数量
input ushort   code=159;    // 在DRAW_ARROW绘制的符号代码
int            color_sections;
//--- 标图的指标缓冲区
double         ColorArrowBuffer[];
//--- 存储颜色标引的缓冲区
double         ColorArrowColors[];
//--- 存储颜色的数组包含14种元素
color colors[]=
  {
   clrRed,clrBlue,clrGreen,clrChocolate,clrMagenta,clrDodgerBlue,clrGoldenrod,
   clrIndigo,clrLightBlue,clrAliceBlue,clrMoccasin,clrWhiteSmoke,clrCyan,clrMediumPurple
  };
//+------------------------------------------------------------------+
//| 自定义指标初始化函数                                                |
//+------------------------------------------------------------------+
int OnInit()
  {
//--- 指标缓冲区映射
   SetIndexBuffer(0,ColorArrowBuffer,INDICATOR_DATA);
   SetIndexBuffer(1,ColorArrowColors,INDICATOR_COLOR_INDEX);
//--- 定义PLOT_ARROW绘制的符号代码
   PlotIndexSetInteger(0,PLOT_ARROW,code);
//--- 设置箭头的像素垂直移动
   PlotIndexSetInteger(0,PLOT_ARROW_SHIFT,5);
//--- 设置空值为 0
   PlotIndexSetDouble(0,PLOT_EMPTY_VALUE,0);
//---- 为正弦曲线填充颜色的颜色数量
   color_sections=8;   //  请见注释#property indicator_color1
//---
   return(INIT_SUCCEEDED);
  }
//+------------------------------------------------------------------+
//| 自定义指标迭代函数                                                 |
//+------------------------------------------------------------------+
int OnCalculate(const int rates_total,
                const int prev_calculated,
                const datetime &time[],
                const double &open[],
                const double &high[],
                const double &low[],
                const double &close[],
                const long &tick_volume[],
                const long &volume[],
                const int &spread[])
  {
   static int ticks=0;
//--- 计算订单号改变颜色,大小,移动和箭头的代码
   ticks++;
//--- 如果订单号的临界值被积累
   if(ticks>=N)
     {
      //--- 改变箭头属性
      ChangeLineAppearance();
      //--- 改变用于绘制直方图的颜色
      ChangeColors(colors,color_sections);
      //--- 重置0计数器
      ticks=0;
     }

//--- 计算指标值的模块
   int start=1;
   if(prev_calculated > 0) start=prev_calculated-1;
//--- 计算循环
   for(int i=1;i < rates_total;i++)
     {
      //--- 如果当前收盘价高于之前的价格,请绘制一个箭头
      if(close[i]>close[i-1])
         ColorArrowBuffer[i]=close[i];
      //--- 否则指定null 值
      else
         ColorArrowBuffer[i]=0;
      //--- 箭头颜色
      int index=i%color_sections;
      ColorArrowColors[i]=index;
     }
//--- 返回 prev_calculated值以便下次调用函数
   return(rates_total);
  }
//+------------------------------------------------------------------+
//| 改变线段颜色                                                       |
//+------------------------------------------------------------------+
void  ChangeColors(color  &cols[],int plot_colors)
  {
//--- 颜色数
   int size=ArraySize(cols);
//---
   string comm=ChartGetString(0,CHART_COMMENT)+"\r\n\r\n";

//--- 为每个颜色标引随机定义一个新的颜色
   for(int plot_color_ind=0;plot_color_ind<plot_colors;plot_color_ind++)
     {
      //--- 获得随机数
      int number=MathRand();
      //--- 获得col[]数组的标引作为整数除法的余数
      int i=number%size;
      //--- 设置每个标引的颜色为 PLOT_LINE_COLOR属性
      PlotIndexSetInteger(0,                    //  图形样式数量
                          PLOT_LINE_COLOR,      //  属性标识符
                          plot_color_ind,       //  颜色标引,我们在这里编写颜色
                          cols[i]);             //  新颜色
      //--- 编写颜色
      comm=comm+StringFormat("ArrowColorIndex[%d]=%s \r\n",plot_color_ind,ColorToString(cols[i],true));
      ChartSetString(0,CHART_COMMENT,comm);
     }
//---
  }
//+------------------------------------------------------------------+
//| 改变指标的线型显示外观                                              |
//+------------------------------------------------------------------+
void ChangeLineAppearance()
  {
//--- 形成线型属性信息的字符串
   string comm="";
//--- 改变线型宽度的模块
   int number=MathRand();
//--- 获得整数除法余数的宽度
   int width=number%5; // 宽度设置从 0 到 4
//--- 设置颜色为PLOT_LINE_WIDTH属性
   PlotIndexSetInteger(0,PLOT_LINE_WIDTH,width);
//--- 写下线型宽度
   comm=comm+" Width="+IntegerToString(width);

//--- 改变箭头代码 (PLOT_ARROW)的模块
   number=MathRand();
//--- 获得整数除法的余数来计算新的箭头代码(从0到19)
   int code_add=number%20;
//--- 设置新的符号代码作为ode+code_add的结果
   PlotIndexSetInteger(0,PLOT_ARROW,code+code_add);
//--- 写下符号代码 PLOT_ARROW
   comm="\r\n"+"PLOT_ARROW="+IntegerToString(code+code_add)+comm;

//--- 改变箭头的像素垂直移动的模块
   number=MathRand();
//--- 获得整数除法余数的移动
   int shift=20-number%41;
//--- 设置新移动自
   PlotIndexSetInteger(0,PLOT_ARROW_SHIFT,shift);
//--- 写下PLOT_ARROW_SHIFT移动
   comm="\r\n"+"PLOT_ARROW_SHIFT="+IntegerToString(shift)+comm;

//--- 使用注释在图表上显示信息
   Comment(comm);
  }
2
3
4
5
6
7
8
9
10
11
12
13
14
15
16
17
18
19
20
21
22
23
24
25
26
27
28
29
30
31
32
33
34
35
36
37
38
39
40
41
42
43
44
45
46
47
48
49
50
51
52
53
54
55
56
57
58
59
60
61
62
63
64
65
66
67
68
69
70
71
72
73
74
75
76
77
78
79
80
81
82
83
84
85
86
87
88
89
90
91
92
93
94
95
96
97
98
99
100
101
102
103
104
105
106
107
108
109
110
111
112
113
114
115
116
117
118
119
120
121
122
123
124
125
126
127
128
129
130
131
132
133
134
135
136
137
138
139
140
141
142
143
144
145
146
147
148
149
150
151
152
153
154
155
156
157
158
159
160
161
162
163
164
165
166
167
168
169
170
171
# 24.1.16 DRAW_COLOR_ZIGZAG
DRAW_COLOR_ZIGZAG 样式使用两个指标缓冲区的值绘制不同颜色的线段。该样式是 DRAW_ZIGZAG的彩色版,例如,允许为每节线段指定来自预定义颜色的独立颜色。线段从第一个缓冲区的值 绘制 到第二个指标缓冲区的值。缓冲区不会只包含空值,因为在这种情况下,不会绘制任何线段。
线段的宽度,颜色和线型的指定类似 DRAW_ZIGZAG 样式 —— 可以使用预编译器指令进行设置 和/或 使用PlotIndexSetInteger()函数进行动态设置。绘图属性的动态变化允许“激活”指标,以便于可以根据当前状况改变其外观。
从一个缓冲区的非空值 到 另一个指标缓冲区的非空值 绘制线段部分。若要指定哪个值应被视为“空”,请在 PLOT_EMPTY_VALUE 属性设定该值:
//--- 0(空)值将不参与绘制
   PlotIndexSetDouble(index_of_plot_DRAW_COLOR_ZIGZAG,PLOT_EMPTY_VALUE,0);
2
始终明确填写指标缓冲区的值,在缓冲区中设置 空 值以跳过对应的K线柱。
样式DRAW_COLOR_ZIGZAG 所需的缓冲区的数量是3个: • 两个缓冲区用于存储zigzag线段的终端值; • 一个缓冲区存储颜色索引,它被用于绘制线段(它使得仅设置非空值有意义)。
指标示例:基于 最高价 和 最低价 绘制zigzag 线段的颜色,宽度和样式每N个跳价都会随机变化一次。

请注意,最初DRAW_COLOR_ZIGZAG样式的 属性 中,定义了8种颜色,这时是使用编译程序指令 #property设置的,然后在 OnCalculate() 函数中,颜色 是从数组colors[] 中的14种颜色中随机设置的。
参数 N 为指标的外部参数,即表示手动配置成为可能(在指标属性窗口-->参数 标签中)。
//+------------------------------------------------------------------+
//|                                            DRAW_COLOR_ZIGZAG.mq5 |
//|                        Copyright 2011, MetaQuotes Software Corp. |
//|                                             https://www.mql5.com |
//+------------------------------------------------------------------+
#property copyright "Copyright 2011, MetaQuotes Software Corp."
#property link      "https://www.mql5.com"
#property version   "1.00"

#property description "An indicator to demonstrate DRAW_COLOR_ZIGZAG"
#property description "It draws a broken line as a sequence of colored sections, the color depends on the number of the day of the week"
#property description "The color, width and style of segments are changed randomly"
#property description " every N ticks"

#property indicator_chart_window
#property indicator_buffers 3
#property indicator_plots   1
//--- 标图Color_Zigzag
#property indicator_label1  "Color_Zigzag"
#property indicator_type1   DRAW_COLOR_ZIGZAG
//--- 定义8 种用于填充节段的颜色(它们存储在指定数组)
#property indicator_color1  clrRed,clrBlue,clrGreen,clrYellow,clrMagenta,clrCyan,clrLime,clrOrange
#property indicator_style1  STYLE_SOLID
#property indicator_width1  1
//--- 输入参数
input int      N=5;              // 改变订单号数量
int            color_sections;
//--- 节段终端缓冲区的值
double         Color_ZigzagBuffer1[];
double         Color_ZigzagBuffer2[];
//--- 节段终端缓冲区的颜色标引
double         Color_ZigzagColors[];
//--- 存储颜色的数组包含14种元素
color colors[]=
  {
   clrRed,clrBlue,clrGreen,clrChocolate,clrMagenta,clrDodgerBlue,clrGoldenrod,
   clrIndigo,clrLightBlue,clrAliceBlue,clrMoccasin,clrWhiteSmoke,clrCyan,clrMediumPurple
  };
//--- 存储线型样式的数组
ENUM_LINE_STYLE styles[]={STYLE_SOLID,STYLE_DASH,STYLE_DOT,STYLE_DASHDOT,STYLE_DASHDOTDOT};
//+------------------------------------------------------------------+
//| 自定义指标初始化函数                                                |
//+------------------------------------------------------------------+
int OnInit()
  {
//--- 指标缓冲区映射
   SetIndexBuffer(0,Color_ZigzagBuffer1,INDICATOR_DATA);
   SetIndexBuffer(1,Color_ZigzagBuffer2,INDICATOR_DATA);
   SetIndexBuffer(2,Color_ZigzagColors,INDICATOR_COLOR_INDEX);
//----为zigzag填充颜色的颜色数量
   color_sections=8;   //  请见注释 #property indicator_color1 属性
//---
   return(INIT_SUCCEEDED);
  }
//+------------------------------------------------------------------+
//| 自定义指标迭代函数                                                 |
//+------------------------------------------------------------------+
int OnCalculate(const int rates_total,
                const int prev_calculated,
                const datetime &time[],
                const double &open[],
                const double &high[],
                const double &low[],
                const double &close[],
                const long &tick_volume[],
                const long &volume[],
                const int &spread[])
  {
   static int ticks=0;
//--- 计算订单号改变样式,颜色和线型宽度
   ticks++;
//--- 如果足够数量的订单号被积累
   if(ticks>=N)
     {
      //--- 改变线型属性
      ChangeLineAppearance();
      //--- 改变用于标图节段的颜色
      ChangeColors(colors,color_sections);
      //--- 重置0计数器
      ticks=0;
     }

//--- 获得每个柱形工作日所需的时间结构
   MqlDateTime dt;

//--- 计算的初始位置
   int start=0;
//--- 如果在前一个订单号计算指标,那么在倒数第二个开始计算
   if(prev_calculated!=0) start=prev_calculated-1;
//--- 计算循环
   for(int i=start;i<rates_total;i++)
     {
      //--- 在结构中写下柱形的开盘时间
      TimeToStruct(time[i],dt);

      //--- 如果柱形数量
      if(i%2==0)
        {
         //---  在第一个缓冲区写下最高价,在第二个缓冲区写下最低价
         Color_ZigzagBuffer1[i]=high[i];
         Color_ZigzagBuffer2[i]=low[i];
         //--- 节段的颜色
         Color_ZigzagColors[i]=dt.day_of_year%color_sections;
        }
      //--- 柱形数量是奇数
      else
        {
         //--- 按相反顺序填写柱形
         Color_ZigzagBuffer1[i]=low[i];
         Color_ZigzagBuffer2[i]=high[i];
         //--- 节段的颜色
         Color_ZigzagColors[i]=dt.day_of_year%color_sections;
        }
     }
//--- 返回 prev_calculated值以便下次调用函数
   return(rates_total);
  }
//+------------------------------------------------------------------+
//| 改变zigzag节段的颜色                                               |
//+------------------------------------------------------------------+
void  ChangeColors(color  &cols[],int plot_colors)
  {
//--- 颜色数
   int size=ArraySize(cols);
//---
   string comm=ChartGetString(0,CHART_COMMENT)+"\r\n\r\n";

//--- 为每个颜色标引随机定义一个新的颜色
   for(int plot_color_ind=0;plot_color_ind<plot_colors;plot_color_ind++)
     {
      //--- 获得随机数
      int number=MathRand();
      //--- 获得col[]数组的标引作为整数除法的余数
      int i=number%size;
      //--- 设置每个标引的颜色为 PLOT_LINE_COLOR属性
      PlotIndexSetInteger(0,                    //  图形样式数量
                          PLOT_LINE_COLOR,      //  属性标识符
                          plot_color_ind,       //  颜色标引,我们在这里编写颜色
                          cols[i]);             //  新颜色
      //--- 编写颜色
      comm=comm+StringFormat("ZigzagColorIndex[%d]=%s \r\n",plot_color_ind,ColorToString(cols[i],true));
      ChartSetString(0,CHART_COMMENT,comm);
     }
//---
  }
//+------------------------------------------------------------------+
//| 改变zigzag节段的外观                                               |
//+------------------------------------------------------------------+
void ChangeLineAppearance()
  {
//--- 形成Color_ZigZag属性信息的字符串
   string comm="";
//--- 改变线型宽度的模块
   int number=MathRand();
//--- 获得整数除法余数的宽度
   int width=number%5;   // 宽度设置从 0 到 4
//--- 设置颜色为PLOT_LINE_WIDTH属性
   PlotIndexSetInteger(0,PLOT_LINE_WIDTH,width);
//--- 写下线型宽度
   comm=comm+"\r\nWidth="+IntegerToString(width);

//--- 改变线型样式的模块
   number=MathRand();
//--- 除数等于样式数组的大小
   int size=ArraySize(styles);
//--- 获得选择新样式作为整数除法余数的标引
   int style_index=number%size;
//--- 设置颜色为 PLOT_LINE_COLOR 属性
   PlotIndexSetInteger(0,PLOT_LINE_STYLE,styles[style_index]);
//--- 写下线型样式
   comm="\r\n"+EnumToString(styles[style_index])+""+comm;
//--- 使用注释在图表上显示信息
   Comment(comm);
  }
2
3
4
5
6
7
8
9
10
11
12
13
14
15
16
17
18
19
20
21
22
23
24
25
26
27
28
29
30
31
32
33
34
35
36
37
38
39
40
41
42
43
44
45
46
47
48
49
50
51
52
53
54
55
56
57
58
59
60
61
62
63
64
65
66
67
68
69
70
71
72
73
74
75
76
77
78
79
80
81
82
83
84
85
86
87
88
89
90
91
92
93
94
95
96
97
98
99
100
101
102
103
104
105
106
107
108
109
110
111
112
113
114
115
116
117
118
119
120
121
122
123
124
125
126
127
128
129
130
131
132
133
134
135
136
137
138
139
140
141
142
143
144
145
146
147
148
149
150
151
152
153
154
155
156
157
158
159
160
161
162
163
164
165
166
167
168
169
170
171
172
173
174
# 24.1.17 DRAW_COLOR_BARS
DRAW_COLOR_BARS 样式根据四个指标缓冲区的值,包括开盘价,最高价,最低价和收盘价绘制美式棒线图。该样式是DRAW_BARS 的高级版,允许为每根棒线单独指定来自预定义颜色中的颜色。它用于创建自定义指标为美式棒线,包括单独的图表子窗口(副图)中 和 其他金融工具(交易品种)上的指标(叠加报价图表)。
美式棒线图颜色的设置可以使用预编译器指令进行设置 和/或 使用PlotIndexSetInteger()函数进行动态设置。绘图属性的动态变化允许“激活”指标,以便于可以根据当前状况改变其外观。
指标仅绘制有具体报价美式棒线图,为此,所有四个指标缓冲区的设置,都必须为非空值。 若要指定哪个值应被视为“空”,请在 PLOT_EMPTY_VALUE 属性设定该值:
//--- 0(空)值将不参与绘制
   PlotIndexSetDouble(index_of_plot_DRAW_COLOR_BARS,PLOT_EMPTY_VALUE,0);
2
始终明确填写指标缓冲区的值,在缓冲区设置空值跳过对应的K线柱。
样式DRAW_COLOR_BARS 所需的缓冲区的数量是5个: • 四个缓冲区用于存储开盘价,最高价,最低价和收盘价值; • 一个缓冲区用于存储颜色索引,它被用于绘制柱形 (它使得仅设置将被绘制的美式棒线有意义)。
样式的所有缓冲区都应该按照给定的顺序一个接一个地进行:开盘价,最高价,最低价,收盘价和颜色缓冲区。价格缓冲区不能只包含null值,因为在这种情况下,不会绘制任何棒线。
指标示例:在单独窗口(副图窗口)中的绘制选定金融工具(交易品种)的美式棒线图。美式棒线的颜色每 N个跳价之后都会随机变化一次。参数 N 为指标的外部参数,即表示手动配置成为可能(在指标属性窗口-->参数 标签中)。

DRAW_COLOR_BARS样式的示例
请注意,最初DRAW_COLOR_BARS样式的 属性 中,定义了8种颜色,这时是使用编译程序指令 #property设置的,然后在 OnCalculate() 函数中,颜色 是从数组colors[] 中的14种颜色中随机设置的。
//+------------------------------------------------------------------+
//|                                              DRAW_COLOR_BARS.mq5 |
//|                        Copyright 2011, MetaQuotes Software Corp. |
//|                                             https://www.mql5.com |
//+------------------------------------------------------------------+
#property copyright "Copyright 2011, MetaQuotes Software Corp."
#property link      "https://www.mql5.com"
#property version   "1.00"

#property description "An indicator to demonstrate DRAW_COLOR_BARS"
#property description "It draws different-color bars of a selected symbol in a separate window"
#property description "The color and width of bars, as well as the symbol are changed randomly"
#property description "every N ticks"

#property indicator_separate_window
#property indicator_buffers 5
#property indicator_plots   1
//--- 标图 ColorBars
#property indicator_label1  "ColorBars"
#property indicator_type1   DRAW_COLOR_BARS
//--- 定义8种用于填充柱形的颜色(它们存储在指定数组)
#property indicator_color1  clrRed,clrBlue,clrGreen,clrYellow,clrMagenta,clrCyan,clrLime,clrOrange
#property indicator_style1  STYLE_SOLID
#property indicator_width1  1
//--- 输入参数
input int      N=5;              // 改变类型的订单号数量
input int      bars=500;         // 显示的柱形数量
input bool     messages=false;   // 在"EA交易"日志显示信息
//--- 指标缓冲区
double         ColorBarsBuffer1[];
double         ColorBarsBuffer2[];
double         ColorBarsBuffer3[];
double         ColorBarsBuffer4[];
double         ColorBarsColors[];
//--- 交易品种名称
string symbol;
int    bars_colors;
//--- 存储颜色的数组包含14种元素
color colors[]=
  {
   clrRed,clrBlue,clrGreen,clrChocolate,clrMagenta,clrDodgerBlue,clrGoldenrod,
   clrIndigo,clrLightBlue,clrAliceBlue,clrMoccasin,clrMagenta,clrCyan,clrMediumPurple
  };
//+------------------------------------------------------------------+
//| 自定义指标初始化函数                                                |
//+------------------------------------------------------------------+
int OnInit()
  {
//--- 指标缓冲区映射
   SetIndexBuffer(0,ColorBarsBuffer1,INDICATOR_DATA);
   SetIndexBuffer(1,ColorBarsBuffer2,INDICATOR_DATA);
   SetIndexBuffer(2,ColorBarsBuffer3,INDICATOR_DATA);
   SetIndexBuffer(3,ColorBarsBuffer4,INDICATOR_DATA);
   SetIndexBuffer(4,ColorBarsColors,INDICATOR_COLOR_INDEX);
//---- 为柱形填充颜色的颜色数量
   bars_colors=8;   // 请见注释#property indicator_color1 属性
//---
   return(INIT_SUCCEEDED);
  }
//+------------------------------------------------------------------+
//| 自定义指标迭代函数                                                  |
//+------------------------------------------------------------------+
int OnCalculate(const int rates_total,
                const int prev_calculated,
                const datetime &time[],
                const double &open[],
                const double &high[],
                const double &low[],
                const double &close[],
                const long &tick_volume[],
                const long &volume[],
                const int &spread[])
  {
   static int ticks=0;
//--- 计算订单号改变样式,颜色和柱形宽度
   ticks++;
//--- 如果足够数量的订单号被积累
   if(ticks>=N)
     {
      //--- 选择来自市场报价窗口的新交易品种
      symbol=GetRandomSymbolName();
      //--- 改变线型属性
      ChangeLineAppearance();
      //--- 改变用于绘制蜡烛图的颜色
      ChangeColors(colors,bars_colors);
      int tries=0;
      //--- 试图5 次填充缓冲区的交易品种价格
      while(!CopyFromSymbolToBuffers(symbol,rates_total,bars_colors) && tries<5)
        {
         //--- CopyFromSymbolToBuffers() 函数调用的计数器
         tries++;
        }
      //--- 重置0计数器
      ticks=0;
     }
//--- 返回 prev_calculated值以便下次调用函数
   return(rates_total);
  }
//+------------------------------------------------------------------+
//| 填充指标缓冲区的价格                                                |
//+------------------------------------------------------------------+
bool CopyFromSymbolToBuffers(string name,int total,int bar_colors)
  {
//--- 在rates[] 数组中,我们将复制开盘价,最高价,最低价和收盘价
   MqlRates rates[];
//--- 尝试计数器
   int attempts=0;
//--- 已复制多少
   int copied=0;
//--- 试图25次获得所需交易品种的时间帧
   while(attempts<25 && (copied=CopyRates(name,_Period,0,bars,rates))<0)
     {
      Sleep(100);
      attempts++;
      if(messages) PrintFormat("%s CopyRates(%s) attempts=%d",__FUNCTION__,name,attempts);
     }
//--- 如果复制足够数量的柱形失败
   if(copied!=bars)
     {
      //--- 形成信息字符串
      string comm=StringFormat("For the symbol %s, managed to receive only %d bars of %d requested ones",
                               name,
                               copied,
                               bars
                               );
      //--- 在主图表窗口的注释中显示信息
      Comment(comm);
      //--- 显示信息
      if(messages) Print(comm);
      return(false);
     }
   else
     {
      //--- 设置交易品种的展示
      PlotIndexSetString(0,PLOT_LABEL,name+" Open;"+name+" High;"+name+" Low;"+name+" Close");
      IndicatorSetString(INDICATOR_SHORTNAME,"DRAW_COLOR_BARS("+name+")");
     }
//--- 初始化空值缓冲区
   ArrayInitialize(ColorBarsBuffer1,0.0);
   ArrayInitialize(ColorBarsBuffer2,0.0);
   ArrayInitialize(ColorBarsBuffer3,0.0);
   ArrayInitialize(ColorBarsBuffer4,0.0);

//--- 复制缓冲区的价格
   for(int i=0;i<copied;i++)
     {
      //--- 计算缓冲区相应的标引
      int buffer_index=total-copied+i;
      //--- 写下缓冲区的价格
      ColorBarsBuffer1[buffer_index]=rates[i].open;
      ColorBarsBuffer2[buffer_index]=rates[i].high;
      ColorBarsBuffer3[buffer_index]=rates[i].low;
      ColorBarsBuffer4[buffer_index]=rates[i].close;
      //---
      ColorBarsColors[buffer_index]=i%bar_colors;
     }
   return(true);
  }
//+------------------------------------------------------------------+
//| 随机返回来自市场报价的交易品种                                       |
//+------------------------------------------------------------------+
string GetRandomSymbolName()
  {
//--- 市场报价窗口中显示的交易品种数量
   int symbols=SymbolsTotal(true);
//--- 列表中的交易品种位置 - 从0到交易品种的随机号
   int number=MathRand()%symbols;
//--- 返回指定位置的交易品种名称
   return SymbolName(number,true);
  }
//+------------------------------------------------------------------+
//| 改变zigzag节段的颜色                                               |
//+------------------------------------------------------------------+
void  ChangeColors(color  &cols[],int plot_colors)
  {
//--- 颜色数
   int size=ArraySize(cols);
//---
   string comm=ChartGetString(0,CHART_COMMENT)+"\r\n\r\n";

//--- 为每个颜色标引随机定义一个新的颜色
   for(int plot_color_ind=0;plot_color_ind<plot_colors;plot_color_ind++)
     {
      //--- 获得随机数
      int number=MathRand();
      //--- 获得col[]数组的标引作为整数除法的余数
      int i=number%size;
      //--- 设置每个标引的颜色为 PLOT_LINE_COLOR属性
      PlotIndexSetInteger(0,                    //  图形样式数量
                          PLOT_LINE_COLOR,      //  属性标识符
                          plot_color_ind,       //  颜色标引,我们在这里编写颜色
                          cols[i]);             // 新颜色
      //--- 编写颜色
      comm=comm+StringFormat("BarColorIndex[%d]=%s \r\n",plot_color_ind,ColorToString(cols[i],true));
      ChartSetString(0,CHART_COMMENT,comm);
     }
//---
  }
//+------------------------------------------------------------------+
//| 改变柱形的外观                                                     |
//+------------------------------------------------------------------+
void ChangeLineAppearance()
  {
//--- 形成柱形属性信息的字符串
   string comm="";

//--- 改变柱形宽度的模块
   int number=MathRand();
//--- 获得整数除法余数的宽度
   int width=number%5;   // 宽度设置从 0 到 4
//--- 设置颜色为PLOT_LINE_WIDTH属性
   PlotIndexSetInteger(0,PLOT_LINE_WIDTH,width);
//--- 写下线型宽度
   comm=comm+"\r\nWidth="+IntegerToString(width);

//--- 写下交易品种名称
   comm="\r\n"+symbol+comm;

//--- 使用注释在图表上显示信息
   Comment(comm);
  }
2
3
4
5
6
7
8
9
10
11
12
13
14
15
16
17
18
19
20
21
22
23
24
25
26
27
28
29
30
31
32
33
34
35
36
37
38
39
40
41
42
43
44
45
46
47
48
49
50
51
52
53
54
55
56
57
58
59
60
61
62
63
64
65
66
67
68
69
70
71
72
73
74
75
76
77
78
79
80
81
82
83
84
85
86
87
88
89
90
91
92
93
94
95
96
97
98
99
100
101
102
103
104
105
106
107
108
109
110
111
112
113
114
115
116
117
118
119
120
121
122
123
124
125
126
127
128
129
130
131
132
133
134
135
136
137
138
139
140
141
142
143
144
145
146
147
148
149
150
151
152
153
154
155
156
157
158
159
160
161
162
163
164
165
166
167
168
169
170
171
172
173
174
175
176
177
178
179
180
181
182
183
184
185
186
187
188
189
190
191
192
193
194
195
196
197
198
199
200
201
202
203
204
205
206
207
208
209
210
211
212
213
214
215
216
217
218
219
220
221
# 24.1.18 DRAW_COLOR_CANDLES
DRAW_COLOR_CANDLES 样式类似 DRAW_CANDLES根据四个指标缓冲区的值,包括开盘价,最高价,最低价和收盘价绘制日式蜡烛图。另外,它还允许为每根蜡烛图单独指定来自预定义颜色中的颜色。为此,该样式为每根蜡烛,都有一个特定的颜色缓冲区。它用于创建日式蜡烛图指标,包括单独的图表子窗口(副图)中 和 其他金融工具(交易品种)上的指标(叠加报价图表)。
日式蜡烛图颜色的设置可以使用预编译器指令进行设置 和/或 使用PlotIndexSetInteger()函数进行动态设置。绘图属性的动态变化允许“激活”指标,以便于可以根据当前状况改变其外观。
指标仅绘制有具体报价日式蜡烛图,为此,所有四个指标缓冲区的设置,都必须为非空值。 若要指定哪个值应被视为“空”,请在 PLOT_EMPTY_VALUE 属性设定该值:
//--- 0(空)值将不参与绘制
   PlotIndexSetDouble(index_of_plot_DRAW_COLOR_CANDLES,PLOT_EMPTY_VALUE,0);
2
始终明确填写指标缓冲区的值,在缓冲区设置空值跳过对应的K线柱。
样式DRAW_COLOR_CANDLES 所需的缓冲区的数量是5个: • 四个缓冲区用于存储开盘价,最高价,最低价和收盘价值; • 一个缓冲区用于存储颜色索引,它被用于绘制柱形 (它使得仅设置将被绘制的美式棒线有意义)。
样式的所有缓冲区都应该按照给定的顺序一个接一个地进行:开盘价,最高价,最低价,收盘价和颜色缓冲区。价格缓冲区不能只包含null值,因为在这种情况下,不会绘制任何棒线。
指标示例:在单独窗口(副图窗口)中的绘制选定金融工具(交易品种)的日式蜡烛图。日式蜡烛的颜色每 N个跳价之后都会随机变化一次。参数 N 为指标的外部参数,即表示手动配置成为可能(在指标属性窗口-->参数 标签中)。

请注意,样式的属性最新是使用编译程序指令#property设置颜色,然后在OnCalculate() 函数,从之前准备的颜色列表中随机设置颜色。
//+------------------------------------------------------------------+
//|                                           DRAW_COLOR_CANDLES.mq5 |
//|                        Copyright 2011, MetaQuotes Software Corp. |
//|                                             https://www.mql5.com |
//+------------------------------------------------------------------+
#property copyright "Copyright 2011, MetaQuotes Software Corp."
#property link      "https://www.mql5.com"
#property version   "1.00"

#property description "An indicator to demonstrate DRAW_COLOR_CANDLES."
#property description "It draws candlesticks of a selected symbol in a separate window"
#property description " "
#property description "The color and width of candlesticks, as well as the symbol are changed"
#property description "randomly every N ticks"

#property indicator_separate_window
#property indicator_buffers 5
#property indicator_plots   1
//--- 标图 ColorCandles
#property indicator_label1  "ColorCandles"
#property indicator_type1   DRAW_COLOR_CANDLES
//--- 定义8种用于填充蜡烛图的颜色(它们存储在指定数组)
#property indicator_color1  clrRed,clrBlue,clrGreen,clrYellow,clrMagenta,clrCyan,clrLime,clrOrange
#property indicator_style1  STYLE_SOLID
#property indicator_width1  1

//--- 输入参数
input int      N=5;              // 改变类型的订单号数量
input int      bars=500;         // 显示的蜡烛图数量
input bool     messages=false;   // 在"EA交易"日志显示信息
//--- 指标缓冲区
double         ColorCandlesBuffer1[];
double         ColorCandlesBuffer2[];
double         ColorCandlesBuffer3[];
double         ColorCandlesBuffer4[];
double         ColorCandlesColors[];
int            candles_colors;
//--- 交易品种名称
string symbol;
//--- 存储颜色的数组包含14种元素
color colors[]=
  {
   clrRed,clrBlue,clrGreen,clrChocolate,clrMagenta,clrDodgerBlue,clrGoldenrod,
   clrIndigo,clrLightBlue,clrAliceBlue,clrMoccasin,clrMagenta,clrCyan,clrMediumPurple
  };
//+------------------------------------------------------------------+
//| 自定义指标初始化函数                                                |
//+------------------------------------------------------------------+
int OnInit()
  {
//--- 如果柱形非常小 - 提前完成工作
   if(bars<50)
     {
      Comment("Please specify a larger number of bars! The operation of the indicator has been terminated");
      return(INIT_PARAMETERS_INCORRECT);
     }
//--- 指标缓冲区映射
   SetIndexBuffer(0,ColorCandlesBuffer1,INDICATOR_DATA);
   SetIndexBuffer(1,ColorCandlesBuffer2,INDICATOR_DATA);
   SetIndexBuffer(2,ColorCandlesBuffer3,INDICATOR_DATA);
   SetIndexBuffer(3,ColorCandlesBuffer4,INDICATOR_DATA);
   SetIndexBuffer(4,ColorCandlesColors,INDICATOR_COLOR_INDEX);
//--- 空值
   PlotIndexSetDouble(0,PLOT_EMPTY_VALUE,0);
//--- 绘制柱形的交易品种名称
   symbol=_Symbol;
//--- 设置交易品种的展示
   PlotIndexSetString(0,PLOT_LABEL,symbol+" Open;"+symbol+" High;"+symbol+" Low;"+symbol+" Close");
   IndicatorSetString(INDICATOR_SHORTNAME,"DRAW_COLOR_CANDLES("+symbol+")");
//---- 为蜡烛图填充颜色的颜色数量
   candles_colors=8;     //  请见注释#property indicator_color1 属性
//---
   return(INIT_SUCCEEDED);
  }
//+------------------------------------------------------------------+
//| 自定义指标迭代函数                                                  |
//+------------------------------------------------------------------+
int OnCalculate(const int rates_total,
                const int prev_calculated,
                const datetime &time[],
                const double &open[],
                const double &high[],
                const double &low[],
                const double &close[],
                const long &tick_volume[],
                const long &volume[],
                const int &spread[])
  {
   static int ticks=INT_MAX-100;
//--- 计算订单号改变样式,颜色
   ticks++;
//--- 如果足够数量的订单号被积累
   if(ticks>=N)
     {
      //--- 选择来自市场报价窗口的新交易品种
      symbol=GetRandomSymbolName();
      //--- 改变格式
      ChangeLineAppearance();
      //--- 改变用于绘制蜡烛图的颜色
      ChangeColors(colors,candles_colors);

      int tries=0;
      //--- 试图5 次填充缓冲区plot1的交易品种价格
      while(!CopyFromSymbolToBuffers(symbol,rates_total,0,
            ColorCandlesBuffer1,ColorCandlesBuffer2,ColorCandlesBuffer3,
            ColorCandlesBuffer4,ColorCandlesColors,candles_colors)
            && tries<5)
        {
         //--- CopyFromSymbolToBuffers() 函数调用的计数器
         tries++;
        }
      //--- 重置0计数器
      ticks=0;
     }
//--- 返回 prev_calculated值以便下次调用函数
   return(rates_total);
  }
//+------------------------------------------------------------------+
//| 填充指定蜡烛图                                                     |
//+------------------------------------------------------------------+
bool CopyFromSymbolToBuffers(string name,
                             int total,
                             int plot_index,
                             double &buff1[],
                             double &buff2[],
                             double &buff3[],
                             double &buff4[],
                             double &col_buffer[],
                             int    cndl_colors
                             )
  {
//--- 在rates[] 数组中,我们将复制开盘价,最高价,最低价和收盘价
   MqlRates rates[];
//--- 尝试计数器
   int attempts=0;
//--- 已复制多少
   int copied=0;
//--- 试图25次获得所需交易品种的时间帧
   while(attempts<25 && (copied=CopyRates(name,_Period,0,bars,rates))<0)
     {
      Sleep(100);
      attempts++;
      if(messages) PrintFormat("%s CopyRates(%s) attempts=%d",__FUNCTION__,name,attempts);
     }
//--- 如果复制足够数量的柱形失败
   if(copied!=bars)
     {
      //--- 形成信息字符串
      string comm=StringFormat("For the symbol %s, managed to receive only %d bars of %d requested ones",
                               name,
                               copied,
                               bars
                               );
      //--- 在主图表窗口的注释中显示信息
      Comment(comm);
      //--- 显示信息
      if(messages) Print(comm);
      return(false);
     }
   else
     {
      //--- 设置交易品种的展示
      PlotIndexSetString(plot_index,PLOT_LABEL,name+" Open;"+name+" High;"+name+" Low;"+name+" Close");
      IndicatorSetString(INDICATOR_SHORTNAME,"DRAW_COLOR_CANDLES("+symbol+")");
     }
//--- 初始化空值缓冲区
   ArrayInitialize(buff1,0.0);
   ArrayInitialize(buff2,0.0);
   ArrayInitialize(buff3,0.0);
   ArrayInitialize(buff4,0.0);
//--- 在每个订单号上复制缓冲区价格
   for(int i=0;i<copied;i++)
     {
      //--- 计算缓冲区相应的标引
      int buffer_index=total-copied+i;
      //--- 写下缓冲区的价格
      buff1[buffer_index]=rates[i].open;
      buff2[buffer_index]=rates[i].high;
      buff3[buffer_index]=rates[i].low;
      buff4[buffer_index]=rates[i].close;
      //--- 设置蜡烛图颜色
      int color_index=i%cndl_colors;
      col_buffer[buffer_index]=color_index;
     }
   return(true);
  }
//+------------------------------------------------------------------+
//| 随机返回来自市场报价的交易品种                                       |
//+------------------------------------------------------------------+
string GetRandomSymbolName()
  {
//--- 市场报价窗口中显示的交易品种数量
   int symbols=SymbolsTotal(true);
//--- 列表中的交易品种位置 - 从0到交易品种的随机号
   int number=MathRand()%symbols;
//--- 返回指定位置的交易品种名称
   return SymbolName(number,true);
  }
//+------------------------------------------------------------------+
//| 改变蜡烛图节段的颜色                                                |
//+------------------------------------------------------------------+
void  ChangeColors(color  &cols[],int plot_colors)
  {
//--- 颜色数
   int size=ArraySize(cols);
//---
   string comm=ChartGetString(0,CHART_COMMENT)+"\r\n\r\n";

//--- 为每个颜色标引随机定义一个新的颜色
   for(int plot_color_ind=0;plot_color_ind<plot_colors;plot_color_ind++)
     {
      //--- 获得随机数
      int number=MathRand();
      //--- 获得col[]数组的标引作为整数除法的余数
      int i=number%size;
      //--- 设置每个标引的颜色为 PLOT_LINE_COLOR属性
      PlotIndexSetInteger(0,                    //  图形样式数量
                          PLOT_LINE_COLOR,      //  属性标识符
                          plot_color_ind,       //  颜色标引,我们在这里编写颜色
                          cols[i]);             //  新颜色
      //--- 编写颜色
      comm=comm+StringFormat("CandleColorIndex[%d]=%s \r\n",plot_color_ind,ColorToString(cols[i],true));
      ChartSetString(0,CHART_COMMENT,comm);
     }
//---
  }
//+------------------------------------------------------------------+
//| 改变蜡烛图的外观                                                   |
//+------------------------------------------------------------------+
void ChangeLineAppearance()
  {
//--- 形成蜡烛图属性信息的字符串
   string comm="";
//--- 写下交易品种名称
   comm="\r\n"+symbol+comm;
//--- 使用注释在图表上显示信息
   Comment(comm);
  }
2
3
4
5
6
7
8
9
10
11
12
13
14
15
16
17
18
19
20
21
22
23
24
25
26
27
28
29
30
31
32
33
34
35
36
37
38
39
40
41
42
43
44
45
46
47
48
49
50
51
52
53
54
55
56
57
58
59
60
61
62
63
64
65
66
67
68
69
70
71
72
73
74
75
76
77
78
79
80
81
82
83
84
85
86
87
88
89
90
91
92
93
94
95
96
97
98
99
100
101
102
103
104
105
106
107
108
109
110
111
112
113
114
115
116
117
118
119
120
121
122
123
124
125
126
127
128
129
130
131
132
133
134
135
136
137
138
139
140
141
142
143
144
145
146
147
148
149
150
151
152
153
154
155
156
157
158
159
160
161
162
163
164
165
166
167
168
169
170
171
172
173
174
175
176
177
178
179
180
181
182
183
184
185
186
187
188
189
190
191
192
193
194
195
196
197
198
199
200
201
202
203
204
205
206
207
208
209
210
211
212
213
214
215
216
217
218
219
220
221
222
223
224
225
226
227
228
229
230
231
232
233
234
235
236
237
238
# 24.2 指标属性和函数间的连接
每个自定义指标都有很多属性,有些是强制的并且始终在描述的开始位置,它们通常具有如下属性: • 绘制指标的窗口 —— 单独的指标窗口,即副图窗口 (indicator_separate_window) 或者 主图窗口(indicator_chart_window); • 指标缓冲区数量 —— indicator_buffers; • 指标绘制类型的数量 —— indicator_plots。
也可以通过 预处理器 指令或者建立自定义指标的函数建立其它属性。这些属性和类似函数在如下表格中描述。
| 指标子窗口属性指令 | IndicatorSet...()型函数 | 调整过的子窗口属性指令 |
|---|---|---|
| indicator_height | IndicatorSetInteger(INDICATOR_INDICATOR_HEIGHT, nHeight) | 子窗口高度的修正值 |
| indicator_minimum | IndicatorSetDouble(INDICATOR_MINIMUM, dMaxValue) | 纵轴最小值 |
| indicator_maximum | IndicatorSetDouble(INDICATOR_MAXIMUM, dMinValue) | 纵轴最大值 |
| indicator_levelN | IndicatorSetDouble(INDICATOR_LEVELVALUE, N-1, nLevelValue) | N水平面纵轴值 |
| 无预处理器指令 | IndicatorSetString(INDICATOR_LEVELTEXT, N-1, sLevelName) | 显示的水平面名称 |
| indicator_levelcolor | IndicatorSetInteger(INDICATOR_LEVELCOLOR, N-1, nLevelColor) | N水平面颜色 |
| indicator_levelwidth | IndicatorSetInteger(INDICATOR_LEVELWIDTH, N-1, nLevelWidth) | N平面的线宽 |
| indicator_levelstyle | IndicatorSetInteger(INDICATOR_LEVELSTYLE, N-1, nLevelStyle) | N平面的线型 |
| indicator_labelN | PlotIndexSetString(N-1,PLOT_LABEL,sLabel) | 图N缩略名。当鼠标光标放在上面时显示在数据窗口和弹出提示框中 |
| indicator_styleN | PlotIndexSetInteger(N-1, PLOT_LINE_STYLE, nType) | 图N的线型 |
| indicator_typeN | PlotIndexSetInteger(N-1, PLOT_DRAW_TYPE, nType) | 图N的线种 |
| indicator_widthN | PlotIndexSetInteger(N-1, PLOT_LINE_WIDTH, nWidth) | 图N的线宽 |
| 常用指标属性 | IndicatorSet...()型函数 | 描述 |
|---|---|---|
| 无预处理器指令 | IndicatorSetString(INDICATOR_SHORTNAME, sShortName) | 设置显示在指标列表(在客户端中按Ctrl+I打开)中的指标的便捷短名称。 |
| 无预处理器指令 | IndicatorSetInteger(INDICATOR_DIGITS, nDigits) | 设置指标值显示所需的精度----小数点后保留几位数。 |
| 无预处理器指令 | IndicatorSetInteger(INDICATOR_LEVELS, nLevels) | 设置指标窗口水平线的数量 |
| indicator_applied_price | 无函数,属性仅可以通过预处理器指令设置。 | 用于指标计算的默认价格类型。只有使用OnCalculate()时被指定。 |
应当注意,预处理器指令中的 级别 和 绘图类型 的索引编号从 1 开始,而使用函数时相同属性的索引编号从 零 开始,即指标内的索引编号数值必须比#property指示的值小1。(这一点应该特别注意。—— 智能交易*姚 提示)
有几个指令,没有相应的函数:
| 指令 | 描述 |
|---|---|
| indicator_chart_window | 指标显示在主窗口中 |
| indicator_separate_window | 指标显示在独立子窗口(副图窗口)中 |
| indicator_buffers | 所需 指标缓冲区 的数量 |
| indicator_plots | 指标中的 绘图类型 的数量 |
# 24.3 SetIndexBuffer
该函数将指定的 指标缓冲区 与 双精度(double)类型的一维动态数组绑定。
bool  SetIndexBuffer(
   int                    index,         // 缓冲指数
   double                 buffer[],      // 数组
   ENUM_INDEXBUFFER_TYPE  data_type      // 要存储的东西
   );
2
3
4
5
参数
index
[in] 指标缓冲区的索引数字,编号从0开始,该数字必须小于 #property indicator_buffers中声明的值。
buffer[]
[in] 在自定义指标程序中声明一个数组。
data_type
[in] 存储在指标数组中的数据类型。默认情况下,它是INDICATOR_DATA(计算指标的值)。它也可能需要INDICATOR_COLOR_INDEX的值; 在这种情况下,此缓冲区用于存储前一个指标缓冲区的颜色索引。您可以在 #property indicator_colorN 命令行中指定最多64种颜色。 INDICATOR_CALCULATIONS值表示缓冲区用于指标的中间计算,不用于绘图。
返回值
如果成功,返回 true, 否则返回 false。
注意
绑定后,动态数组buffer []将被重新编入索引号,就像在公共数组中一样,即使之前为绑定数组预先设置了 时间序列 的索引。如果要更改对指标数组元素的访问顺序,请在使用SetIndexBuffer()函数绑定数组后使用ArraySetAsSeries()函数。请注意,您无法通过函数SetIndexBuffer()更改设置为指标缓冲区的动态数组的大小。对于指标缓冲区,所有大小改变操作都由客户端的执行子系统执行。
示例:
//+------------------------------------------------------------------+
//|                                              TestCopyBuffer1.mq5 |
//|                        Copyright 2009, MetaQuotes Software Corp. |
//|                                             https://www.mql5.com |
//+------------------------------------------------------------------+
#property copyright "2009, MetaQuotes Software Corp."
#property link      "https://www.mql5.com"
#property version   "1.00"

#property indicator_separate_window
#property indicator_buffers 1
#property indicator_plots   1
//---- 图 MA
#property indicator_label1  "MA"
#property indicator_type1   DRAW_LINE
#property indicator_color1  clrRed
#property indicator_style1  STYLE_SOLID
#property indicator_width1  1
//--- 输入参量
input bool               AsSeries=true;
input int                period=15;
input ENUM_MA_METHOD     smootMode=MODE_EMA;
input ENUM_APPLIED_PRICE price=PRICE_CLOSE;
input int                shift=0;
//--- 指标缓冲
double                   MABuffer[];
int                      ma_handle;
//+------------------------------------------------------------------+
//| 自定义指标初始化函数                                                |
//+------------------------------------------------------------------+
int OnInit()
  {
//--- 指标缓冲绘图
   if(AsSeries) ArraySetAsSeries(MABuffer,true);
   Print("Indicator buffer is timeseries = ",ArrayGetAsSeries(MABuffer));
   SetIndexBuffer(0,MABuffer,INDICATOR_DATA);
   Print("Indicator buffer after SetIndexBuffer() is timeseries = ",
         ArrayGetAsSeries(MABuffer));

//--- 更待指标缓冲访问单元命令
   ArraySetAsSeries(MABuffer,AsSeries);

   IndicatorSetString(INDICATOR_SHORTNAME,"MA("+period+")"+AsSeries);
//---
   ma_handle=iMA(Symbol(),0,period,shift,smootMode,price);
   return(INIT_SUCCEEDED);
  }
//+------------------------------------------------------------------+
//| 自定义指标重复函数                                                  |
//+------------------------------------------------------------------+
int OnCalculate(const int rates_total,
                const int prev_calculated,
                const datetime &time[],
                const double &open[],
                const double &high[],
                const double &low[],
                const double &close[],
                const long &tick_volume[],
                const long &volume[],
                const int &spread[])
  {
//--- 复制缓冲区MABuffer中的移动平均值
   int copied=CopyBuffer(ma_handle,0,0,rates_total,MABuffer);

   Print("MABuffer[0] = ",MABuffer[0]);// 取决于AsSeries值
                                      // 将收到旧值
                                      // 或者为当前未完成的字节

//--- 为下一次调用返回prev_calculated值
   return(rates_total);
  }
//+------------------------------------------------------------------+
2
3
4
5
6
7
8
9
10
11
12
13
14
15
16
17
18
19
20
21
22
23
24
25
26
27
28
29
30
31
32
33
34
35
36
37
38
39
40
41
42
43
44
45
46
47
48
49
50
51
52
53
54
55
56
57
58
59
60
61
62
63
64
65
66
67
68
69
70
71
72
相关参考
自定义指标属性, 访问时间序列和指标
# 24.4 IndicatorSetDouble
该函数设置相应指标属性的值。指标属性必须是 双精度(double)类型。该函数有两种变体。
- 通过指定的属性标识符进行调用。
bool  IndicatorSetDouble(
   int     prop_id,           // 标识符
   double  prop_value         // 将被设置的值
   );
2
3
4
- 通过指定的属性标识符和属性修饰语调用。
bool  IndicatorSetDouble(
   int     prop_id,           // 标识符
   int     prop_modifier,     // 修饰语
   double  prop_value         // 将被设置的值
   )
2
3
4
5
参数
prop_id
[in] 取值范围是 ENUM_CUSTOMIND_PROPERTY_DOUBLE 枚举值之一。
prop_modifier
[in] 指定属性的修饰符。只有水平属性需要修饰符。水平级别的编号从0开始。这意味着为了设置第二级的属性,您需要指定1(比使用预编译指令时少1)。
prop_value
[in] 属性值。
返回值
如果成功,返回 true,否则返回 false。
注意
使用 #property指令时属性(修饰符)的索引编号从1开始,而函数使用的索引编号是从 0开始的。如果水平级别的索引编号设置错误,那么指标显示的效果可能与预期的不同。 例如,在单独子窗口的指标第一水平值可以通过两种方式设置: • property indicator_level1 50 —— 值1用于指定水平级别的索引编号, • IndicatorSetDouble(INDICATOR_LEVELVALUE, 0, 50) —— 此处0 表示第一个水平级别的索引编号。
示例:指标颠倒指标窗口的最大值和最小值以及放置水平线的级别值。

#property indicator_separate_window
//--- 设置指标窗口的最大最小值
#property indicator_minimum  0
#property indicator_maximum  100
//--- 在单独指标窗口展示三条水平线
#property indicator_level1 25
#property indicator_level2 50
#property indicator_level3 75
//--- 设置水平线的粗细
#property indicator_levelwidth 1
//--- 设置水平线的样式
#property indicator_levelstyle STYLE_DOT
//+------------------------------------------------------------------+
//| 自定义指标初始化函数                                                |
//+------------------------------------------------------------------+
int OnInit()
  {
//--- 设置水平线的描述
   IndicatorSetString(INDICATOR_LEVELTEXT,0,"First Level (index 0)");
   IndicatorSetString(INDICATOR_LEVELTEXT,1,"Second Level (index 1)");
   IndicatorSetString(INDICATOR_LEVELTEXT,2,"Third Level (index 2)");
//--- 设置指标缩略名
   IndicatorSetString(INDICATOR_SHORTNAME,"IndicatorSetDouble() Demo");
//--- 设置每个水平的颜色
   IndicatorSetInteger(INDICATOR_LEVELCOLOR,0,clrBlue);
   IndicatorSetInteger(INDICATOR_LEVELCOLOR,1,clrGreen);
   IndicatorSetInteger(INDICATOR_LEVELCOLOR,2,clrRed);
//---
   return(INIT_SUCCEEDED);
  }
//+------------------------------------------------------------------+
//| 自定义指标迭代函数                                                 |
//+------------------------------------------------------------------+
int OnCalculate(const int rates_total,
                const int prev_calculated,
                const datetime &time[],
                const double &open[],
                const double &high[],
                const double &low[],
                const double &close[],
                const long &tick_volume[],
                const long &volume[],
                const int &spread[])
  {
   static int tick_counter=0;
   static double level1=25,level2=50,level3=75;
   static double max=100,min=0, shift=100;
//--- 计算订单号
   tick_counter++;
//--- 每10个订单号颠倒一次水平
   if(tick_counter%10==0)
     {
      //--- 水平值的颠倒符号
      level1=-level1;
      level2=-level2;
      level3=-level3;
      //--- 最大最小值的颠倒符号
      max-=shift;
      min-=shift;
      //--- 颠倒替换值
      shift=-shift;
      //--- 设置新的水平值
      IndicatorSetDouble(INDICATOR_LEVELVALUE,0,level1);
      IndicatorSetDouble(INDICATOR_LEVELVALUE,1,level2);
      IndicatorSetDouble(INDICATOR_LEVELVALUE,2,level3);
      //--- 在指标窗口设置新的最大最小值
      Print("Set up max = ",max,",   min = ",min);
      IndicatorSetDouble(INDICATOR_MAXIMUM,max);
      IndicatorSetDouble(INDICATOR_MINIMUM,min);
     }
//--- 返回prev_calculated值以便下次调用
   return(rates_total);
  }
2
3
4
5
6
7
8
9
10
11
12
13
14
15
16
17
18
19
20
21
22
23
24
25
26
27
28
29
30
31
32
33
34
35
36
37
38
39
40
41
42
43
44
45
46
47
48
49
50
51
52
53
54
55
56
57
58
59
60
61
62
63
64
65
66
67
68
69
70
71
72
73
相关参考
指标类型示例, 指标属性和函数间的连接, 绘画风格
# 24.5 IndicatorSetInteger
该函数设置相应指标属性的值。指标属性必须是 整数 或 颜色类型。该函数有两种变体。
- 通过指定的属性标识符进行调用。
bool  IndicatorSetInteger(
   int  prop_id,           // 标识符
   int  prop_value         // 将被设置的值
   );
2
3
4
- 通过指定的属性标识符和属性修饰语调用。
bool  IndicatorSetInteger(
   int  prop_id,           // 标识符
   int  prop_modifier,     // 修饰符
   int  prop_value         // 将被设置的值
   )
2
3
4
5
参数
prop_id
[in] 取值范围是ENUM_CUSTOMIND_PROPERTY_INTEGER 枚举值之一。
prop_modifier
[in] 指定属性的修饰符。只有水平属性需要修饰符。水平级别的编号从0开始。这意味着为了设置第二个水平级别的属性,您需要指定1(比使用预编译指令时少1)。
prop_value
[in] 属性值。
返回值
如果成功,返回 true,否则返回 false。
注意
使用 #property指令时属性(修饰符)的索引编号从1开始,而函数使用的索引编号是从 0开始的。如果水平级别的索引编号设置错误,那么指标显示的效果可能与预期的不同。 例如,若要设置第一水平线的粗细,请使用索引编号 0: • IndicatorSetInteger(INDICATOR_LEVELWIDTH, 0, 5) -标引 0 用于设定第一水平的粗细。
示例:设置指标水平线的颜色,线型和粗细的指标。
#property indicator_separate_window
#property indicator_minimum 0
#property indicator_maximum 100
//--- 在单独指标窗口展示三条水平线
#property indicator_level1 20
#property indicator_level2 50
#property indicator_level3 80
//--- 设置水平线的粗细
#property indicator_levelwidth 5
//--- 设置水平线的颜色
#property indicator_levelcolor clrAliceBlue
//--- 设置水平线的样式
#property indicator_levelstyle STYLE_DOT
//+------------------------------------------------------------------+
//| 自定义指标初始化函数                                                |
//+------------------------------------------------------------------+
int OnInit()
  {
//--- 设置水平线的描述
   IndicatorSetString(INDICATOR_LEVELTEXT,0,"First Level (index 0)");
   IndicatorSetString(INDICATOR_LEVELTEXT,1,"Second Level (index 1)");
   IndicatorSetString(INDICATOR_LEVELTEXT,2,"Third Level (index 2)");
//--- 设置指标缩略名
   IndicatorSetString(INDICATOR_SHORTNAME,"IndicatorSetInteger() Demo");
   return(INIT_SUCCEEDED);
  }
//+------------------------------------------------------------------+
//| 自定义指标迭代函数                                                  |
//+------------------------------------------------------------------+
int OnCalculate(const int rates_total,
                const int prev_calculated,
                const datetime &time[],
                const double &open[],
                const double &high[],
                const double &low[],
                const double &close[],
                const long &tick_volume[],
                const long &volume[],
                const int &spread[])
  {
   static int tick_counter=0;
//--- 计算订单号
   tick_counter++;
//--- 根据订单号计数器计算水平线的颜色
   ChangeLevelColor(0,tick_counter,3,6,10); // 三个最后的参数切换颜色
   ChangeLevelColor(1,tick_counter,3,6,8);
   ChangeLevelColor(2,tick_counter,4,7,9);
//--- 更改水平线的样式
   ChangeLevelStyle(0,tick_counter);
   ChangeLevelStyle(1,tick_counter+5);
   ChangeLevelStyle(2,tick_counter+15);
//--- 获得宽度为订单号整数除法除以5的余数
   int width=tick_counter%5;
//--- 迭代所有水平线并设置粗细
   for(int l=0;l<3;l++)
      IndicatorSetInteger(INDICATOR_LEVELWIDTH,l,width+1);
//--- 返回prev_calculated值以便下次调用
   return(rates_total);
  }
//+------------------------------------------------------------------+
//| 在单独指标窗口设置水平线颜色                                         |
//+------------------------------------------------------------------+
void ChangeLevelColor(int level,      // 水平线数
                      int tick_number,// 被除数,获得除法余数的数
                      int f_trigger,  // 第一个颜色切换除数
                      int s_trigger,  // 第二个颜色切换除数
                      int t_trigger)  // 第三个颜色切换除数
  {
   static color colors[3]={clrRed,clrBlue,clrGreen};
//--- colors[]数组的颜色标引
   int index=-1;
//--- 计算来自colors[]数组的颜色数为水平线涂色
   if(tick_number%f_trigger==0)
      index=0;   // 如果tick_number被f_trigger除,没有余数
   if(tick_number%s_trigger==0)
      index=1;   // 如果tick_number被s_trigger除,没有余数
   if(tick_number%t_trigger==0)
      index=2;   // 如果tick_number被t_trigger除,没有余数
//--- 如果定义颜色,设置它
   if(index!=-1)
      IndicatorSetInteger(INDICATOR_LEVELCOLOR,level,colors[index]);
//---
  }
//+------------------------------------------------------------------+
//| 在单独指标窗口设置水平线的样式                                       |
//+------------------------------------------------------------------+
void ChangeLevelStyle(int level,     // 水平线数
                      int tick_number// 获得除法余数的数
                      )
  {
//--- 存储样式的数组
   static ENUM_LINE_STYLE styles[5]=
     {STYLE_SOLID,STYLE_DASH,STYLE_DOT,STYLE_DASHDOT,STYLE_DASHDOTDOT};
//--- styles[]数组的样式标引
   int index=-1;
//--- 计算styles[]数组的数字来设置水平线的样式
   if(tick_number%50==0)
      index=5;   // 如果tick_number 被50除没有余数,那么样式是STYLE_DASHDOTDOT
   if(tick_number%40==0)
      index=4;   // ... 样式是 STYLE_DASHDOT
   if(tick_number%30==0)
      index=3;   // ... STYLE_DOT
   if(tick_number%20==0)
      index=2;   // ... STYLE_DASH
   if(tick_number%10==0)
      index=1;   // ... STYLE_SOLID
//--- 如果定义样式,设置它
   if(index!=-1)
      IndicatorSetInteger(INDICATOR_LEVELSTYLE,level,styles[index]);
  }
2
3
4
5
6
7
8
9
10
11
12
13
14
15
16
17
18
19
20
21
22
23
24
25
26
27
28
29
30
31
32
33
34
35
36
37
38
39
40
41
42
43
44
45
46
47
48
49
50
51
52
53
54
55
56
57
58
59
60
61
62
63
64
65
66
67
68
69
70
71
72
73
74
75
76
77
78
79
80
81
82
83
84
85
86
87
88
89
90
91
92
93
94
95
96
97
98
99
100
101
102
103
104
105
106
107
108
109
110
相关参考
自定义指标属性,程序属性(#property),绘画风格
# 24.6 IndicatorSetString
该函数设置相应指标属性的值。指标属性必须是 字符串型。该函数有两种变体。
- 通过指定的属性标识符进行调用。
bool  IndicatorSetString(
   int     prop_id,           // 标识符
   string  prop_value         // 将被设置的值
   );
2
3
4
- 通过指定的属性标识符和属性修饰语调用。
bool  IndicatorSetString(
   int     prop_id,           // 标识符
   int     prop_modifier,     // 修饰符
   string  prop_value         // 将被设置的值
   )
2
3
4
5
参数
prop_id
[in] 取值范围是ENUM_CUSTOMIND_PROPERTY_STRING 枚举值之一。
prop_modifier
[in] 指定属性的修饰符。只有水平属性需要修饰符。水平级别的编号从0开始。这意味着为了设置第二个水平级别的属性,您需要指定1(比使用预编译指令时少1)。
prop_value
[in] 属性值。
返回值
如果成功,返回 true,否则返回 false。
注意
使用 #property指令时属性(修饰符)的索引编号从1开始,而函数使用的索引编号是从 0开始的。如果水平级别的索引编号设置错误,那么指标显示的效果可能与预期的不同。 例如,若要设置第一水平线的粗细,请使用索引编号 0: • IndicatorSetString(INDICATOR_LEVELTEXT, 0, "First Level") —— 索引编号 0 用于设定第一水平级别的文本描述。
示例:设置指标水平线的文本标签的指标。

#property indicator_separate_window
#property indicator_minimum 0
#property indicator_maximum 100
//--- 在单独指标窗口展示三条水平线
#property indicator_level1 30
#property indicator_level2 50
#property indicator_level3 70
//--- 设置水平线的颜色
#property indicator_levelcolor clrRed
//--- 设置水平线的样式
#property indicator_levelstyle STYLE_SOLID
//+------------------------------------------------------------------+
//| 自定义指标初始化函数                                                |
//+------------------------------------------------------------------+
int OnInit()
  {
//--- 设置水平线的描述
   IndicatorSetString(INDICATOR_LEVELTEXT,0,"First Level (index 0)");
   IndicatorSetString(INDICATOR_LEVELTEXT,1,"Second Level (index 1)");
   IndicatorSetString(INDICATOR_LEVELTEXT,2,"Third Level (index 2)");
//--- 设置指标缩略名
   IndicatorSetString(INDICATOR_SHORTNAME,"IndicatorSetString() Demo");
//---
   return(INIT_SUCCEEDED);
  }
//+------------------------------------------------------------------+
//| 自定义指标迭代函数                                                 |
//+------------------------------------------------------------------+
int OnCalculate(const int rates_total,
                const int prev_calculated,
                const datetime &time[],
                const double &open[],
                const double &high[],
                const double &low[],
                const double &close[],
                const long &tick_volume[],
                const long &volume[],
                const int &spread[])
  {
//---

//--- 返回prev_calculated值以便下次调用
   return(rates_total);
  }
2
3
4
5
6
7
8
9
10
11
12
13
14
15
16
17
18
19
20
21
22
23
24
25
26
27
28
29
30
31
32
33
34
35
36
37
38
39
40
41
42
43
44
相关参考
自定义指标属性, 程序属性 (#property)
# 24.7 PlotIndexSetDouble
该函数设置指定指标的相应属性的值。指标属性必须是 双精度(double)类型。
bool  PlotIndexSetDouble(
   int     plot_index,     // 图样式指数
   int     prop_id,        // 属性标识符
   double  prop_value      // 将被设置的值
   );
2
3
4
5
参数
plot_index
[in] 绘制风格的索引编号
prop_id
[in] 取值范围是 ENUM_PLOT_PROPERTY_DOUBLE 枚举值之一。
prop_value
[in] 属性值。
返回值
如果成功,返回 true, 否则 false。
# 24.8 PlotIndexSetInteger
该函数设置指标的相应属性值,指标属性必须是整型,短整型,布尔型或者颜色型。此函数有两种变体。
- 通过指定的属性标识符进行调用。
bool  PlotIndexSetInteger(
   int  plot_index,        // 图样式指数
   int  prop_id,           // 属性标识符
   int  prop_value         // 将被设置的值
   );
2
3
4
5
- 通过指定的属性标识符和属性修饰语调用。
bool  PlotIndexSetInteger(
   int  plot_index,        // 图样式指数
   int  prop_id,           // 属性标识符
   int  prop_modifier,     // 属性修饰符
   int  prop_value         // 将被设置的值
   )
2
3
4
5
6
参数
plot_index
[in] 绘制风格的索引编号
prop_id
[in] 取值范围是ENUM_PLOT_PROPERTY_INTEGER 枚举值之一。
prop_modifier
[in] 指定属性的修饰符。只有颜色索引属性需要修饰符。
prop_value
[in] 属性值。
返回值
如果成功,返回 true,否则 false。
示例:一个绘制三色线的指标。配色方案每5次跳价之后改变一次。
#property indicator_chart_window
#property indicator_buffers 2
#property indicator_plots   1
//---- 图线颜色
#property indicator_label1  "ColorLine"
#property indicator_type1   DRAW_COLOR_LINE
#property indicator_color1  clrRed,clrGreen,clrBlue
#property indicator_style1  STYLE_SOLID
#property indicator_width1  3
//--- 指标缓冲区
double         ColorLineBuffer[];
double         ColorBuffer[];
int            MA_handle;
//+------------------------------------------------------------------+
//| 自定义指标初始化函数                                                |
//+------------------------------------------------------------------+
void OnInit()
  {
//--- 指标缓冲绘图
   SetIndexBuffer(0,ColorLineBuffer,INDICATOR_DATA);
   SetIndexBuffer(1,ColorBuffer,INDICATOR_COLOR_INDEX);
//--- 获得MA处理器
   MA_handle=iMA(Symbol(),0,10,0,MODE_EMA,PRICE_CLOSE);
//---
  }
//+------------------------------------------------------------------+
//| 获得颜色指数                                                       |
//+------------------------------------------------------------------+
int getIndexOfColor(int i)
  {
   int j=i%300;
   if(j<100) return(0);// 第一指数
   if(j<200) return(1);// 第二指数
   return(2); // 第三指数
  }
//+------------------------------------------------------------------+
//| 自定义指标反复函数                                                  |
//+------------------------------------------------------------------+
int OnCalculate(const int rates_total,
                const int prev_calculated,
                const datetime &time[],
                const double &open[],
                const double &high[],
                const double &low[],
                const double &close[],
                const long &tick_volume[],
                const long &volume[],
                const int &spread[])
  {
//---
   static int ticks=0,modified=0;
   int limit;
//--- 第一计算或者柱数被改变
   if(prev_calculated==0)
     {
      //--- 复制MA值到指标缓冲区ColorLineBuffer
      int copied=CopyBuffer(MA_handle,0,0,rates_total,ColorLineBuffer);
      if(copied<=0) return(0);// 复制失败-丢弃
      //--- 现在为每个柱设置线的颜色
      for(int i=0;i<rates_total;i++)
         ColorBuffer[i]=getIndexOfColor(i);
     }
   else
     {
      //--- 复制MA值到指标缓冲区ColorLineBuffer
      int copied=CopyBuffer(MA_handle,0,0,rates_total,ColorLineBuffer);
      if(copied<=0) return(0);

      ticks++;// 数订单号
      if(ticks>=5)//改变配色方案的时候
        {
         ticks=0; // 复位计数器
         modified++; // 颜色更改的计数器
         if(modified>=3)modified=0;// 复位计数器
         ResetLastError();
         switch(modified)
           {
            case 0:// 第一配色方案
               PlotIndexSetInteger(0,PLOT_LINE_COLOR,0,clrRed);
               PlotIndexSetInteger(0,PLOT_LINE_COLOR,1,clrBlue);
               PlotIndexSetInteger(0,PLOT_LINE_COLOR,2,clrGreen);
               Print("Color scheme "+modified);
               break;
            case 1:// 第二配色方案
               PlotIndexSetInteger(0,PLOT_LINE_COLOR,0,clrYellow);
               PlotIndexSetInteger(0,PLOT_LINE_COLOR,1,clrPink);
               PlotIndexSetInteger(0,PLOT_LINE_COLOR,2,clrLightSlateGray);
               Print("Color scheme "+modified);
               break;
            default:// 第三配色方案
               PlotIndexSetInteger(0,PLOT_LINE_COLOR,0,clrLightGoldenrod);
               PlotIndexSetInteger(0,PLOT_LINE_COLOR,1,clrOrchid);
               PlotIndexSetInteger(0,PLOT_LINE_COLOR,2,clrLimeGreen);
               Print("Color scheme "+modified);
           }
        }
      else
        {
         //--- 设置初始位置
         limit=prev_calculated-1;
         //--- 现在为每柱设置线的颜色
         for(int i=limit;i<rates_total;i++)
            ColorBuffer[i]=getIndexOfColor(i);
        }
     }
//--- 为下一次调用返回prev_calculated值
   return(rates_total);
  }
//+------------------------------------------------------------------+
2
3
4
5
6
7
8
9
10
11
12
13
14
15
16
17
18
19
20
21
22
23
24
25
26
27
28
29
30
31
32
33
34
35
36
37
38
39
40
41
42
43
44
45
46
47
48
49
50
51
52
53
54
55
56
57
58
59
60
61
62
63
64
65
66
67
68
69
70
71
72
73
74
75
76
77
78
79
80
81
82
83
84
85
86
87
88
89
90
91
92
93
94
95
96
97
98
99
100
101
102
103
104
105
106
107
108
109
# 24.9 PlotIndexSetString
该函数设置指标的相应属性值,指标属性必须是字符串型。
该函数设置指标的相应属性值,指标属性必须是字符串型。 参数
plot_index
[in] 绘制风格的索引编号
prop_id
[in] 取值范围是ENUM_PLOT_PROPERTY_STRING 枚举值之一。
prop_value
[in] 属性值。
返回值
如果成功,返回 true, 否则返回 false。
# 24.10 PlotIndexGetInteger
该函数设置指标的相应属性值,指标属性必须是整型,短整型,布尔型或者颜色型。此函数有两种变体。
- 通过指定的属性标识符进行调用。
int  PlotIndexGetInteger(
   int  plot_index,        // 图样式指数
   int  prop_id,           // 属性标识符
   );
2
3
4
- 通过指定的属性标识符和属性修饰语调用。
int  PlotIndexGetInteger(
   int  plot_index,        // 绘图指数
   int  prop_id,           // 属性标识符
   int  prop_modifier      // 属性修饰符
   )
2
3
4
5
参数
plot_index
[in] 绘制风格的索引编号
prop_id
[in] 取值范围是ENUM_PLOT_PROPERTY_INTEGER 枚举值之一。
prop_modifier
[in] 指定属性的修饰符。只有颜色索引属性需要修饰符。
prop_value
[in] 属性值。
返回值
如果成功,返回 true,否则 false。
注意
此函数的功能旨在提取相应指标线的绘图设置。此函数通常与PlotIndexSetInteger函数协同工作,将绘制一条线的 绘图属性 复制到 另一条线上。
示例:根据星期几为蜡烛着色的指标。每天的颜色以编程方式设置。

#property indicator_separate_window
#property indicator_buffers 5
#property indicator_plots   1
//---- 蜡烛颜色图
#property indicator_label1  "ColorCandles"
#property indicator_type1   DRAW_COLOR_CANDLES
#property indicator_style1  STYLE_SOLID
#property indicator_width1  1
//--- 指标缓冲区
double         OpenBuffer[];
double         HighBuffer[];
double         LowBuffer[];
double         CloseBuffer[];
double         ColorCandlesColors[];
color          ColorOfDay[6]={CLR_NONE,clrMediumSlateBlue,
                              clrDarkGoldenrod,clrForestGreen,clrBlueViolet,clrRed};
//+------------------------------------------------------------------+
//| 自定义指标初始化函数                                                |
//+------------------------------------------------------------------+
void OnInit()
  {
//--- 指标缓冲区绘图
   SetIndexBuffer(0,OpenBuffer,INDICATOR_DATA);
   SetIndexBuffer(1,HighBuffer,INDICATOR_DATA);
   SetIndexBuffer(2,LowBuffer,INDICATOR_DATA);
   SetIndexBuffer(3,CloseBuffer,INDICATOR_DATA);
   SetIndexBuffer(4,ColorCandlesColors,INDICATOR_COLOR_INDEX);
//--- 颜色缓存区设置颜色数
   PlotIndexSetInteger(0,PLOT_COLOR_INDEXES,6);
//--- 为颜色缓存设置颜色
   for(int i=1;i<6;i++)
      PlotIndexSetInteger(0,PLOT_LINE_COLOR,i,ColorOfDay[i]);
//--- 设置精确度
   IndicatorSetInteger(INDICATOR_DIGITS,_Digits);
   printf("We have %u colors of days",PlotIndexGetInteger(0,PLOT_COLOR_INDEXES));
//---
  }
//+------------------------------------------------------------------+
//| 自定义指标重复函数                                                 |
//+------------------------------------------------------------------+
int OnCalculate(const int rates_total,
                const int prev_calculated,
                const datetime &time[],
                const double &open[],
                const double &high[],
                const double &low[],
                const double &close[],
                const long &tick_volume[],
                const long &volume[],
                const int &spread[])
  {
//---
   int i;
   MqlDateTime t;
//----
   if(prev_calculated==0) i=0;
   else i=prev_calculated-1;
//----
   while(i<rates_total)
     {
      OpenBuffer[i]=open[i];
      HighBuffer[i]=high[i];
      LowBuffer[i]=low[i];
      CloseBuffer[i]=close[i];
      //--- 为每个蜡烛设置颜色
      TimeToStruct(time[i],t);
      ColorCandlesColors[i]=t.day_of_week;
      //---
      i++;
     }
//--- 为下一次调用返回prev_calculated值
   return(rates_total);
  }
//+------------------------------------------------------------------+
2
3
4
5
6
7
8
9
10
11
12
13
14
15
16
17
18
19
20
21
22
23
24
25
26
27
28
29
30
31
32
33
34
35
36
37
38
39
40
41
42
43
44
45
46
47
48
49
50
51
52
53
54
55
56
57
58
59
60
61
62
63
64
65
66
67
68
69
70
71
72
73
74